© Borgis - New Medicine 1/2012, s. 21-24
*Ji-An Li1, Shu-Ying Han1, Chun-Yu Tian1, Jin-Xiu Chu1, Xiang-Bo Gou1, Ting Han1, Jing Bai1, Yan-Ping Zhang1, Peng Cui1, Bo-Nan Zhang1, Hai-mei Bo1, Chen Zhen2, Júlia Bartos3
The Effects of DAIPING (Diabalance) granule on the Glycolipid Metabolism and PTP1B Expression in Liver of type 2 Diabetes Rats1)
1Hebei United University
2Central-European Traditional Chinese Medicine Association, Budapest, Hungary
President: Dr. Chen Zhen
3Semmelweis University, Budapest, Hungary doctorate student
Summary
Aim of the study. The aim of the study is to investigate the effects of the DAIPING (Diabalance) granule on triglyceride (TG), total cholesterol (TC), low-density lipoprotein cholesterol (LDL-C), high-density lipoprotein cholesterol (HDL-C) and the free fatty acids (FFA) in type 2 diabetes rats. At the same time the PTP1B expression in liver of type 2 diabetes rats was evaluated with the use of western blotting and real-time quantitative PCR.
Results. The Daiping particle can decrease the TG, TC, LDL-C and FFA, and can also significantly inhibit the PTP1B expression in liver of type 2 diabetes rats.
Conclusions. The DAIPING (Diabalance) granule can improve the type 2 diabetes.
Introduction
During the therapy of type 2 diabetes, traditional Chinese drug becomes very important because of its multicomponent characteristics and little side effect. Thus the investigation on the inhibitor of PTP1B in traditional Chinese drug aspect has significant purpose. We discovered that Daiping had many effects, including antioxidation, decreasing the blood glucose and blood fat and inhibiting the formation of advanced glycation end products (AGEs). Subsequently, we sought to identify the effect of DAIPING (Diabalance) granule on PTP1B protein expression at the molecular level and investigated the mechanism of DAIPING’s (Diabalance) improvement on type 2 diabetes.
Materials and Methods
Materials
Sixty male Sprague-Dawley rats weighting 200±15 g were purchased from Beijing Medicinal Institute as our experimental animals (Certificated SCXK-2009-0004). The high-fat alimentation was provided by Beijing AoKe Company Limited (Certificated SCXK-2007-00013). All rats were fed normal alimentation and tap water was provided ad libitum.
The DAIPING (Diabalance) granule is composed of Tremella, Mulberry Leaf, Radix Polygoni Multiflori Preparata etc., and it is manufactures by Traditional Chinese Medical College Laboratory of Hebei United University.
Modeling and the evaluation of the diabetes model
Eight rats forming the control group (N) were fed with normal diet for 4 weeks. The other rats were fed with high-fat diet at the same time, then they received streptozotocin (STZ) (Sigma, 25 mg·kg-1) by single tail intravenous injection to establish the type 2 diabetes models and the N group received the citric acid buffer solution accordingly. After five days the type 2 diabetes model was successfully established as the type 2 diabetic rats with fasting blood glucose (FBG) (72 hour abrosia) ≥ 11.1 mmol·L-1.
Subgroup and administration
The type 2 diabetes rats were randomly divided into four groups, ten rats per group. The Metformin rats group (Met) were administered Metformin (0.14 g·kg-1·d-1) orally once a day for four weeks, and the Daiping rats groups were administered Daiping orally at 0.345 g·kg-1·d-1 (DL) and 1.38 g·kg-1·d-1 (DH) respectively. At the same time, the other type 2 diabetes rats group (M) was administered orally with the same dose.
Euglycemic hyperinsulinemic clamp technique
After 12 hours of fasting, blood was collected from the tail vein of rats, and FBG was measured using a glucometer. In vivo, insulin resistance was measured with the euglycemic hyperinsulinemic clamp technique with an infusion of insulin (1 mU·ml-1·min-1 body weight). Blood samples were collected at 10-minute intervals for the immediate measurement of plasma glucose concentrations and 20% glucose was infused at variable rates to maintain glucose level at the steady state. The glucose injection rate (GIR) was measured at 60 minutes of steady state. The general mean of six blood glucose measurements at the steady state is the steady-state blood glucose, and the general mean of the six GIR is the steady state GIR. At the end of the clamps, rats were euthanized, and tissues were obtained for molecular analysis.
The blood serum index
After the last administration, rats were anesthetized and blood samples were obtained from abdominal aorta. The triglyceride (TG), total cholesterol (TC), low-density lipoprotein cholesterol (LDL-C), high density lipoprotein cholesterol (HDL-C) plasma levels were measured with ACA.
Western blotting
The liver was extracted, frozen in liquid nitrogen and kept at -80°C until required. Subsequently, tissues were homogenized in ice-cold lysis buffer 1% Nonident P-40, 1% sodium deoxycholate, 150 mmol NaCl, 1 mmol EDTA, 1 mmol PMSF, 1 mmol NaF, 1 mmol sodium vanadate, 50 mmol Tris-HC1 (pH 7.4), 10 μg·ml-1 Aprotinin, 10 μg·ml-1 Leupeptin. For Western blotting test, equal amounts (either 60 or 90 μg depending on the protein of interest) of protein extract were subjected to SDS-PAGE (10%), and transferred to polyvinylidene difluoride membranes (Millipore) at a constant current (depending on the size of membrane) for 2 h. The membranes were blocked in 10% milk for 1 h. Membranes were probed with the indicated first antibody (BD Biosciences) against specific PTP1B overnight at 4°C, followed by 2-hour incubation with horseradish peroxidase-labeled goat anti-mouse IgG (Beyotime). Immunoreactive proteins were detected using enhanced chemiluminescence (ECL) according to the manufacturer’s manual and quantified by densitometry.
Quantification of PTP1B mRNA expression by real-time quantitative PCR
Total RNA was extracted from the liver of rats using Trizol reagent according to the manufacturer’s instructions. The quality of the extracted RNA was confirmed by a value of 2 for the 28S ribosomal RNA/18S ribosomal RNA ratio after agarose gel electrophoresis. Levels of mRNA for a housekeeping gene (β-actin) and PTP1B gene were measured by real-time quantitative PCR. Total RNA (1 μg) was reverse transcribed into first-strand cDNA using SYBR®primeScript® RT-PCR kit. PCR was performed using 2 μl cDNA, 10 μl SYBR® Primix Ex TaqTM , and the 1.0 μl of primer in a total volume of 20 μl. The PCR primer sequences used were as follows: PTP-1B forward, 5’-CGAGCAGATCGACAAGTCCGG-3’, PTP-1B reverse, 5’-AACTCCTTTGGGCTTCTTCCA-3’, β-actin forward, 5’-ACGGTCAGGTCATCACTATC-3’, β-actin reverse, 5’-TGCCACAGGATTCCATACC-3’. PCR amplification was performed in the following conditions: initial activation of the hot start DNA polymerase for 10 seconds at 95°C followed by 40 cycles of 2 steps (95°C for 15 seconds and 55°C for 20 seconds)
Statistical Analysis
Data were expressed as mean ± SEM. The significance of differences between the groups was analyzed using Student’s test.
Results
Insulin resistance of the euglycemic hyperinsulinemic clamp technique
Compared with the N group, the FBG of the M group was significantly increased (P < 0.01). Two weeks after the administration, the FBG of the Met group (P < 0.05) and DH group (P < 0.01) were lower than the M group respectively, and four weeks after the administration the decrease of FBG was more pronounced. Furthermore, the values of DH group were similar with that of the DH group (tab. 1).
Table 1. The effect of DAIPING (Diabalance) granule on FBG of type 2 diabetes rats.
| Group | N | FBG
(before administration) | FBG (after administration) |
| 2 weeks | 4 weeks |
| N | 8 | 6.49 ± 0.78 | 6.00 ± 0.94 | 6.04 ± 0.59 |
| M | 10 | 22.22 ± 5.49b | 21.81 ± 4.89b | 20.05 ± 4.96b |
| Met | 10 | 23.71 ± 5.83b | 14.69 ± 4.49bd | 12.75 ± 3.90bd |
| DL | 10 | 22.73 ± 6.24b | 18.23 ± 6.53bd | 16.51 ± 4.60b |
| DH | 10 | 23.73 ± 7.28b | 14.54 ± 4.22bd | 11.24 ± 2.76adg |
aP < 0.05, bP < 0.01 compared with N; cP < 0.05, dP < 0.01 compared with M; eP < 0.05, fP < 0.01 compared with Met; gP < 0.05, hP < 0.01 compared with DL
The amount of glucose used in M group was markedly decreased compared with that of the N group (P < 0.01), and the values of DL (P < 0.05) and DH (P < 0.01) groups were higher than that of the M group, but still lower than that of N group (P < 0.01) (tab. 2). The euglycemic hyperinsulinemic clamp technique results exhibited that at the same infusion rates of insulin, the glucose used to maintain the steady state blood glucose was different.
Table 2. Infusion rate of glucose on blood glucose steady state.
| Group | N | Steady state GIR ml.kg-1.min-1 |
| N | 8 | 6.18 ± 0.85 |
| M | 10 | 2.28 ± 0.62a |
| Met | 10 | 4.28 ± 0.72ab |
| DL | 10 | 3.46 ± 0.75ac |
| DH | 10 | 4.05 ± 0.59ab |
aP < 0.05, bP < 0.01 compared with N; cP < 0.05, dP < 0.01 compared with M; eP < 0.05, fP < 0.01 compared with Met; gP < 0.05, hP < 0.01 compared with DL
The effect of Daiping on TG, TC, LDL-C and HDL-C
Compared with the N group, the TG, TC, LDL-C levels in the M group were increased markedly (P < 0.01), and the HDL-C decreased (P < 0.01). But compared with the M group, the TG,TC, LDL-C of Met group and DH group were decreased significantly (P < 0.01), and the HDL-C increased (P < 0.01) (tab. 3).
Table 3. The effect of DAIPING (Diabalance) granule on TG, TC, LDL-C and HDL-C.
| Group | N | TG | TC | LDL-C | HDL-C |
| N | 8 | 0.41 ± 0.05 | 1.20 ± 0.13 | 0.62 ± 0.13 | 0.38 ± 0.04 |
| M | 10 | 1.09 ± 0.16b | 1.75 ± 0.29b | 0.62 ± 0.13 | 0.28 ± 0.04b |
| Met | 10 | 0.47 ± 0.08 | 1.26 ± 0.15d | 0.69 ± 0.15 | 0.36 ± 0.03d |
| DL | 10 | 0.95 ± 0.11b | 1.61 ± 0.19bf | 0.87 ± 0.21ad | 0.30 ± 0.04bf |
| DH | 10 | 0.77 ± 0.09b | 1.30 ± 0.12dh | 0.60 ± 0.13h | 0.35 ± 0.03dg |
aP < 0.05, bP < 0.01 compared with N; cP < 0.05, dP < 0.01 compared with M; eP < 0.05, fP < 0.01 compared with Met; gP < 0.05, hP < 0.01 compared with DL
The protein expression of PTP1B detected by Western Blot
The Western Blot results revealed the following: compared with N group, the expression of PTP1B in liver of the M group was increased, whereas it was significantly decreased in the DH and DL group compared with the M group. The Met group had the similar results (fig. 1).

Fig. 1. The protein expression of PTP1B Detected by Western Blot in rat livers (Protein tyrosine phosphatase 1B (PTP1B) control group (N), type 2 diabetes rats group (M), Metformin rats group (Met), Daiping 0.345 g·kg-1·d-1 (DL), Daiping 1.38 g·kg-1·d-1 (DH).
Abbreviations in figure 1: control group (N), type 2 diabetes rats group (M), Metformin rats group (Met), Daiping 0.345g·kg-1·d-1 (DL), Daiping 1.38 g·kg-1·d-1 (DH).
PTP1B mRNA expressions in the liver of rats
The real-time quantitative PCR results revealed the following: compared with N group, the expression of PTP1B in liver of the M group increased at about 105.6% (P < 0.01), whereas it was significantly decreased in the DH group at about 35.7% (P < 0.01) and DL group at about 20.82% (P < 0.01) compared with the M group (fig. 2).
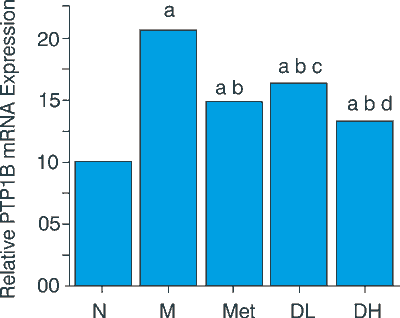
Fig. 2 The expression of PTP1B mRNA detected by real-time quantitative PCR in rats’ livers. Summarized data for data obtained with equation of 2-[Ct(T2D or TFBFL rats)-Ct(CON rats)].
Compared with N group aP<0.01 Compared with M group bP<0.01; Compared with Met group cP>0.05 dP<0.05.
Discussion
The aim of this study was to investigate the molecular mechanism of Daiping action in improving the type 2 diabetes. The results exhibited that Daiping can inhibit the expression of PTP1B significantly, demonstrating that the effect of Daiping on the type 2 diabetes may correlate with PTP1B.
1)This work was supported by China-Hungary government science and technology cooperation projects (NO.4-17) in 2008-2009 of the Ministry of Science and Technology of People’s Republic of China.
Piśmiennictwo
1. Rebecca JG, Gaede LL, Koterski SL et al.: Reduction of protein tyrosine phosphatase 1B increases insulin-dependent signaling in ob/ob Mice. Diabetes 2008; 52; 21-28. 2. Nieto-Vazquez I, Ferna´ndez-Veledo S, de Alvaro C et al.: Protein-tyrosine phosphatase 1B- deficient myocytes show increased insulin sensitivity and protection against tumor necrosis factor-alpha induced insulin resistance. Diabetes 2007; 56; 404-13. 3. Wei Q, Avramoglu RK, Dube N et al.: Hepatic PTP-1B expression regulates the assembly and secretion of apolipoprotein B-containing lipoproteins: evidence from protein tyrosine phosphatase-1B overexpression, knockout, and RNAi studies. Diabetes 2004; 53; 3057-3066. 4. Ahmad F, Azevedo JL, Cortright R et al.: Alterations in skeletal muscle protein-tyrosine phosphatase activity and expression in insulin-resistant human obesity and diabetes. J Clin Invest 1997; 100; 449-58. 5. Wu XD, Hoffstedt J, Deeb W et al.: Depot-Specific variation in protein-tyrosine phosphatase activities in human omental and subcutaneous adipose tissue: a potential contribution to differential insulin sensitivity. J Clin Endocrinol Metab 2001; 86: 5973-5980. 6. Defronzo RA, Tobin J, Andres R: Glucose clam technique: a method for quantifying insulin secretion and resistance. Am J Physiol 1979; 237: 214-223. 7. Zhang ZY: Protein tyrosine phosphatases: structure and function, substrate specificity, and inhibitor development. Annu Rev Pharmacol Toxicol 2002; 42; 209-234. 8. Tonks NK: PTP1B: from the sidelines to the front lines. FFBS Lett 2003; 546: 140-148. 9. Ramachandran C, Kennedy BP: Protein tyrosine phosphatase 1B: a novel target for type 2 diabetes and obesity. Curr Top Med Chem 2003; 3: 749-757. 10. Zabolotny JM, Haj FG, Kim YB et al.: Transgenic overexpression of protein-tyrosine phosphatase 1B in muscle causes insulin resistance, but overexpression with leukocyte antigen-related phosphatase does not additively impair insulin action. The Journal of Biological Chemitry 2004; 179: 24844-24851.