© Borgis - New Medicine 4/2008, s. 82-88
Aleš Gába, Jarmila Riegerová, *Miroslava Přidalová
Evaluation of body composition in females aged 60–84 years using a multi-frequency bioimpedance method (InBody 720)
Department of Functional Anthropology and Physiology, Faculty of Physical Culture, University of Palacký in Olomouc, Czech Republic
Summary
Introduction: Population aging is a serious problem of developed countries worldwide. According to the UN prognosis, the Czech Republic will be among societies with the highest proportion of seniors in the world in 2050. Due to a sedentary lifestyle we can observe an adverse reduction of physical activity, which is critical in the senior population for maintaining optimal physical and mental health. It is understandable that any information on the actual state of the senior population is very valuable. However, we find a deficiency of research targeted at gerontology in the Czech Republic.
Aim: The presented project is aimed at assessing the influence of involution changes on selected anthropometric characteristics in a group of women aged 60–84 years.
Method: The cross-sectional study used a multi-frequency bioimpedance method (InBody 720) to determine the body composition. The monitored group (n=169) was composed of females with a mean age of 69.91 years. The group was divided into five subgroups to evaluate involution changes.
Results: A statistically significant difference was detected (p <0.05) in body height between sub2 and sub3 based on statistical analysis. The mean values of visceral fat were located above the threshold of the health safety zone in all age categories. A significant increase of the visceral fat was detected between sub1 and sub2 (p <0.05). The mean values of WHR evidenced central distribution of the body fat. Differences of mean WHR values between sub1 and sub2 as well as between sub2 and sub3 are significant (p <0.01).
INTRODUCTION
The problem of demographic aging of populations has become a priority in global terms. It invokes the interest of health care personnel and social workers, and causes fears in economists and politicians, who are beginning to realise the extent and impacts of this problem. The number of individuals older than 100 years ( centenarians) and older than 110 years ( supercentenarians)respectively is also rising, creating the most dynamic segment of the population [1]. The following countries have the highest number of supercentenarians: the UK, France, Japan and the Unites States [2].
The process of demographic aging is influenced especially by the population wave of "post-war children” who were born after 1945 in advanced European countries. After 2010, this brings great demands on the pension systems as well as on the organisation and financing of health and social services [3]. Demographic development of the Czech population is consequential according to Burcin [4]. The prognosis of our and UN demographists shows that the Czech Republic may have, together with Italy and Greece, the highest proportion of seniors in the world in the second half of the 21st century. The population prognosis of the Czech Statistical Office [5] basically confirms Burcin´s opinion even though it emphasises that the population development in the Czech Republic is not completely stable and thus it is more difficult to predict.
PROBLEM
Aging is a complex process which is determined and modified by environmental factors [6] (Shephard, 2002). Involution changes (morphological and functional) are characterised by extreme inter-individual variability and heterochrony that lead to a typical picture identified as the geriatric phenotype [3]. All changes related to natural organism evolution are considered as primary aging, whereas results of secondary aging are changes which are conditioned by environmental factors or the presence of disease [7].
We can observe a serious decrease of locomotor activity manifesting in a sedentary lifestyle in economically advanced countries since the second half of the 20th century. We talk about the so-called hypokinetic syndrome. Locomotor activity belongs among the ten most significant causes of mortality and morbidity. European research shows that approximately 49% of Europeans (EU25) perform sedentary employment where they spend on average 5 hours sitting daily [8].
Sufficient locomotor activity is decisive in the senior population as it positively influences physical and mental health. As a result it helps to improve life quality and prevents loss of self-support at a higher age. It is also a significant preventive tool against obesity [9]. People who are physically active are at lower risk of developing chronic diseases, especially those with a prevalence to age condition. Recent research by the WHO [10] drew attention to the significance of locomotor activity in relation to the prevalence of ischaemic heart disease. The WHO report reveals that roughly 20% of all cases develop as a result of locomotor inactivity. In the case of cerebral vascular accident the active population has a lower risk of death by 23–43% than the passive population [11].
Increase of body weight and in some cases development of obesity occur based on reduction of energy output which is disproportionally higher than energy input. Obesity is characterised as increased body weight with an abnormal increase of fat tissue portion [12]. The total amount of body fat and especially its distribution correlate closely with increased risk of developing co-morbidity [13]. In terms of prevention and obesity treatment the effects of increased physical activity were proved most unambiguously in the senior population [14].
The ability to perform everyday activities is a requirement for quality and self-support in aging. A reduction of mobility and flexibility occurs generally in old age and obesity can significantly influence those changes. Apovian et al. [15] describe the connection of the BMI value in elderly women in relation to mobility and flexibility. Obese women are diagnosed with worsening locomotor system functions in upper and lower body parts. Performance of daily activities becomes more difficult for those people.
BMI (body mass index) is most commonly used to classify body weight and determine the size of the relative risk of health damage. The health safety zone as defined by the WHO [16] ranges from 18.5 to 24.9 kg/m2. Kalvach et al. [3] point out the inadequate assessment of senior health state according to BMI values, and Kyle et al. [17, 18] and Schutz et al. [19] also consider the risk assessment in relation to BMI values as inadequate. The result of that is a reduction of body weight in terms of involution and reduction of fat-free mass in later ages, which prevents the correct mortality evaluation in relation to BMI [20]. The amount of body fat and its distribution have a higher predictive value in terms of the assessment of relative health damage risk. The optimal amount of body fat is determined at 30% in the female population older than 55 years, and 16% in the male population [21]. The WHR (waist-hip ratio) index can be used to assess the distribution of body fat or possibly perform diagnosis of the body fat which is found in the visceral area (VFA – visceral fat area).
Body height is the basic morphological parameter where changes can be easily monitored. As the age increases the body height decreases as a result of intervertebral discs drying and spinal curvature increasing. At a higher age we can observe in some cases crushing of one or more vertebrae [6]. Spirduso et al. [7] state that body height decreases from 40 to 60 years of age by 1 cm every decade. This trend substantially accelerates in the following period. De Groot et al. [22] define the reduction of the mean body height in the senior set (entry age 70–75 years) by 1.5–2.0 cm per decade.
Body weight is, besides body height, the most monitored and evaluated anthropometric parameter. In contrast to body height it is less influenced and it is conversely conditioned by environmental factors. Increase of the mean body weight values is occurring at present due to a secondary trend. Extreme reduction of locomotor activity (sedentary lifestyle) and hypokinesis symptoms in higher age categories have however a greater influence than increased food intake with a prevalence of saccharides and lipids alone. A tendency of increase in body weight is generally observed until 60 years of age with gradual decrease in advanced countries.
Body composition changes throughout life and it is influenced by genetic and exogenous factors. With increasing age there is increase and distribution changes of body fat and reduction of muscle and bone mass. Those changes are often associated with menopause in females of mature age II when the secretion of sex hormones is reduced. Oestrogen deficiency speeds up accumulation of body fat and initiates decrease of fat-free mass [23]. The amount of intra-abdominal fat, which is significantly related to risk of cardiovascular co-morbidity and mortality, gradually increases with age [24]. Bone minerals undergo significant change. If the reduction of bone tissue exceeds the threshold of standard deviation –2.5 SD we refer to it as osteoporosis and in the case of muscle tissue reduction by –2.0 SD it is referred to as sarcopenia [25]. We consider age-related muscle tissue reduction as a primary marker of biological aging which is typical for all mammals. A reduction of muscle fraction of 40% occurs in the age range of 20–70 years; we can concomitantly observe a decrease of muscle strength by 30–50% between 30 and 80 years of age [26]. Loss of muscle mass and a decrease of muscle strength can lead to the functional limitation of an individual [9].
With development of new methods designated for monitoring body composition we have even greater possibilities of using other parameters of body composition. Using the BIA method we are able to evaluate the state of total body water (TBW) in the individual body segments as well as the mutual ratio between extracellular (ECW) and intracellular (ICW) water. The amount of total body water is dependant on age and sex. In newborns TBW participates in 80% of body weight, in adulthood in 50–60% (more in males, less in females) and at old age it decreases under the threshold of 50%. The TBW portion is generally lower in females than in males and those sexual differences are apparent from puberty. Individual differences are then mainly created by a diverse amount and distribution of body fat.
AIM
The aim of this trial was to assess the influence of involution changes on selected anthropological features in females aged 60–84 years using a multi-frequency bioimpedance method by means of the InBody 720 device.
METHOD
The group comprised 169 females with the mean age of 69.91 years who were examined based on cooperation with the University of Palacký in Olomouc and the Olomouc Town Council. They were female students of the University of the Third Age at the Faculty of Physical Culture, University of Palacký in Olomouc and senior females who regularly attend senior clubs. Activity and health consciousness were specific selection factors, according to which we can identify our seniors as the active portion of the Czech population. The group was divided into five subgroups based on age differences: sub1 (60.00–64.99), sub2 (65.00–69.99), sub3 (70.00–74.99), sub4 (75.00–79.99) and sub5 (80.00–84.99). Subgroups were defined so that Příhoda´s fifteen-years sequencing [27] was observed, as this compliance is necessary when evaluating involution changes. Even though this is a cross-sectional study where subgroups are not completely homogeneous, we can at least give a preliminary expression to changes between individual age groups.
Examination of body composition was performed by multi-frequency bioimpedance analysis (MFBIA) using an InBody 720 device which measures total impedance using frequencies 1, 5, 50, 100, 500 and 1 000 kHz. The method uses a three-component model to determine relative representation of fractions, which differentiates total body water (intracellular and extracellular water), dry matter (protein and minerals) and body fat [28]. The used methods are unified; measurement was performed in laboratory conditions in compliance with standards given by the device´s manual. Body height was measured within accuracy of 0.5 cm and body weight within accuracy of 0.1 kg.
BMI (body mass index), WHR (waist-hip ratio), FFMI (fat-free mass index), BFMI (body fat mass index) and values of visceral fat (visceral fat area, VFA) were used to evaluate the relative risk of health damage. We observed the health safety zone as defined by the WHO when evaluating BMI and WHR. In the case of FFMI and BFMI we used the classification described by Kyle et al. [18]. When evaluating the visceral fat, we used standards given in the device´s manual (100 cm2). Visceral fat is defined by an area of transversal cross-section in the abdominal area at level L4–L5. Correlation of CT and InBody 720 is defined as 0.92 [29].
The acquired data were processed using appropriate procedures with the help of the Lookin´ Body 3.0 program and statistical program Statistica 7. The Shapiro-Wilk W test of normal distribution was conducted and it was followed by testing the mean differences among individual subgroups. Characteristics complying with the normality requirement were tested for significance of differences using an unpaired t-test; characteristics which did not comply with the normality requirement were tested using the Mann-Whitney test.
RESULTS
Relative changes of anthropometric characteristics examined through multi-frequency bioimpedance analysis are described in Figure 1. To evaluate age-related changes of monitored parameters we divided the group into partial subgroups according to age – 5 subgroups in 5-year intervals from 60 years of age to 80 years of age. We used the mean value for 60 years old (sub1) as the initial level (100%). Generally we can divide the monitored characteristics into three basic groups. The first group constitutes parameters which had a tendency to decline with increasing age. The highest relative decline was recorded in the case of values of muscle fraction, BMI, dry matter (minerals and proteins), fat-free mass and total body water. The mentioned characteristics recorded a relative decline of more than 14%. The last monitored characteristic which showed a tendency to decline with increasing age was body height. Decline of this parameter was not as significant in comparison to the other characteristics. The second group constitutes parameters which had a tendency to decline with increasing age. Characteristics which did comply with this condition included values of visceral fat (relative increment of 18.27%) and values of the WHR index. Parameters included in the third group displayed an initial increase of values which was followed by their decline (body weight, body fat and body cell matter).
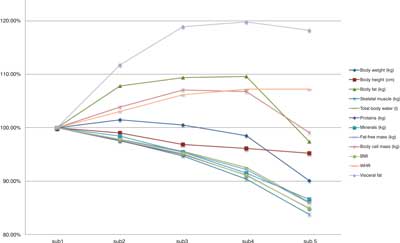
Figure 1 Relative changes of selected somatic parameters
Table 1 presents basic statistical characteristics of chosen somatic parameters. A statistically significant difference was detected (p <0.05) in body height between sub2 and sub3 based on statistical analysis. Other differences of body height were only objectively significant. When evaluating the changes of body weight we observed a minimal difference at first; however, there was a significant decline between sub4 and sub5, where body weight reduction was 6.12 kg. The mean BMI values evidenced over-weight in all subgroups but to evaluate body weight objectively we used parameters which arise from a two-component model of body composition. The mean FFMI (16.33 kg/m2) was within the health safety zone in sub1 but in the other subgroups the FFMI was evaluated as high. In the case of BFMI the mean values were located close to the upper limit of the optimal weight.
Table 1. Selected morphological characteristics of the monitored group (n=169).
Subgroup
Age group | sub 1
60.00-64.99
n=48 | sub 2
65.00-69.99
n=40 | sub 3
70.00-74.99
n=36 | sub 4
75.00-79.99
n=27 | sub 5
80.00-84.99
n=18 |
| x | s | x | s | x | s | x | s | x | s |
| Age | 61.83 | 1.37 | 67.25 | 1.37 | 72.19 | 1.56 | 77.33 | 1.39 | 81.61 | 1.54 |
| Body weight (kg) | 72.57 | 12.14 | 73.64 | 10.11 | 72.95 | 11.93 | 71.50 | 16.43 | 65.38 | 9.62 |
| Body height (cm) | 163.66 | 5.27 | 162.06 | 6.07 | 158.58 | 7.51 | 157.28 | 4.56 | 155.83 | 6.70 |
| Body fat (kg) | 26.24 | 8.24 | 28.30 | 8.72 | 28.72 | 8.85 | 28.78 | 11.95 | 25.57 | 7.14 |
| Body fat (%) | 35.43 | 6.01 | 37.75 | 6.80 | 38.76 | 7.30 | 38.60 | 8.74 | 38.56 | 6.79 |
| Intracellular fluid (l) | 20.83 | 2.39 | 20.36 | 1.75 | 19.83 | 2.77 | 18.97 | 2.43 | 17.71 | 2.30 |
| Extracellular fluid (l) | 13.20 | 1.49 | 12.95 | 1.13 | 12.71 | 1.77 | 12.52 | 1.69 | 11.58 | 1.46 |
| Total body water (l) | 34.03 | 3.87 | 33.31 | 2.86 | 32.54 | 4.51 | 31.49 | 4.09 | 29.29 | 3.70 |
| Proteins (kg) | 9.01 | 1.04 | 8.79 | 0.75 | 8.56 | 1.20 | 8.21 | 1.05 | 7.65 | 1.00 |
| Minerals (kg) | 3.29 | 0.37 | 3.24 | 0.30 | 3.14 | 0.46 | 3.01 | 0.30 | 2.85 | 0.35 |
| Fat-free mass (kg) | 46.33 | 5.26 | 45.34 | 3.89 | 44.23 | 6.16 | 42.72 | 5.41 | 39.81 | 5.00 |
| Skeletal muscles (kg) | 25.17 | 3.13 | 24.57 | 2.28 | 23.85 | 3.63 | 22.75 | 3.16 | 21.09 | 3.01 |
| Skeletal muscles (%) | 35.04 | 3.09 | 33.72 | 3.70 | 32.98 | 4.05 | 32.59 | 4.16 | 32.50 | 3.65 |
| Bone minerals (kg) | 2.72 | 0.30 | 2.68 | 0.24 | 2.61 | 0.38 | 2.51 | 0.24 | 2.38 | 0.27 |
| Cellular matter (kg) | 29.84 | 3.43 | 29.18 | 2.51 | 28.39 | 3.98 | 27.18 | 3.47 | 25.36 | 3.31 |
| BMI (kg/m2) | 27.08 | 4.29 | 28.13 | 4.23 | 29.00 | 4.25 | 28.91 | 6.85 | 26.85 | 3.18 |
| FFMI (kg/m2) | 17.27 | 1.48 | 17.26 | 1.15 | 17.53 | 1.63 | 17.26 | 2.10 | 16.33 | 1.03 |
| BFMI (kg/m2) | 9.81 | 3.14 | 10.87 | 3.56 | 11.47 | 3.51 | 11.65 | 5.04 | 10.52 | 2.85 |
| WHR | 0.97 | 0.05** | 1.00 | 0.05** | 1.03 | 0.05 | 1.04 | 0.07 | 1.04 | 0.03 |
| Visceral fat area (cm2) | 132.66 | 28.94* | 148.24 | 31.57 | 157.77 | 30.31 | 158.98 | 40.37 | 156.90 | 23.91 |
Note: p <0.05, p <0.01
For detailed assessment of involution changes we differentiated the body weight in three basic components: body fat, body water and dry matter. Body fat is the basic and the most variable component in the human body. A 25–30% interval is determined as the health safety zone for the monitored age group. All age groups in the monitored set exceeded the upper limit of the health safety zone. The body fat value was lowest in the case of sub1 (35.43%) and with increasing age the percentage of body fat increased above the 38% threshold (category 70 years old). A similar amount of body fat as in the 70 years of age category was determined in the following age groups but with lower dispersion.
To objectively evaluate the increase of health risk with regard to body fat values it is necessary to closely specify this body fraction and determine its dominant position. The visceral fat values were located above the threshold of the health safety zone (100 cm2) in all age categories. A significant increase of the visceral fat was detected between sub1 and sub2 (p <0.05) and further changes were not statistically significant. Body fat distribution can also be determined using the WHR index. The WHR values were located above the optimal threshold (0.80) in all age categories. The results demonstrate that the monitored senior group has a tendency to central distribution of body fat, which is considered as hazardous with regard to increased incidence of cardiovascular disease, diabetes and changes in the lipid spectrum. Differences of mean WHR values between sub1 and sub2 as well as between sub2 and sub3 are significant (p <0.01).
Body water distribution declined linearly with increasing age but the proportion between extracellular and intracellular was maintained. The greatest decrease of mean body water values occurred between sub4 and sub5, but the difference was only objectively significant. Intracellular fluid participated in the total body water value with 60.80% and extracellular fluid with 39.20%.
Dry matter was the last monitored fraction. Its value is given with the sum of proteins and body minerals. The decrease of protein and minerals was gradual, similarly to the body water; the ratio between the distribution of protein and minerals in the body remained optimally preserved in all subgroups. In the case of bone minerals we observe a similar tendency with regard to total mineral values; however, there is no sharp decline of bone minerals which could signal osteopenia or osteoporosis. We did not pay attention to the osteoporosis issue in this report.
DISCUSSION
At present we do not find the possibility to compare the acquired results with the standards of the Czech population or with a similarly oriented study. The last national anthropometry research was carried out late in the 1990s. The group of interest consisted of individuals younger than 55 years. Due to the above reasons we compared the presented results with a foreign study conducted by Delarue et al. [30] which dealt with the evaluation of anthropometric parameters in French females older than 65 years and with results from Santos et al. [31], who evaluated Chilean females older than 60 years (Table 2). The authors divided the research set into 5-year categories similarly to our study and they used the same methodology to determine basic somatic parameters.
Table 2. Comparison of selected anthropometric characteristics
| | Delarue et al. (1994) | (r) ? | Gába et al. (2008) | (r) ? | Santos et al. (2004) |
| x | s | difference | x | s | difference | x | s |
| 60.00-64.99 |
| | n | - | - | - | 48 | | | 178 | |
| Body weight (kg) | - | - | - | 72.57 | 12.14 | 4.77 | 67.80 | 13.50 |
| Body height (cm) | - | - | - | 163.66 | 5.27 | 12.46 | 151.20 | 6.00 |
| BMI (kg/m2) | - | - | - | 27.08 | 4.29 | -2.42 | 29.65 | - |
| 65.00-69.99 |
| | n | 72 | | | 40 | | | 186 | |
| Body weight (kg) | 67.10 | 12.20 | 6.54 | 73.64 | 10.11 | 6.84 | 66.80 | 14.00 |
| Body height (cm) | 158.00 | 0.06 | 4.06 | 162.06 | 6.07 | 11.06 | 151.00 | 5.80 |
| BMI (kg/m2) | 26.90 | 5.10 | 1.23 | 28.13 | 4.23 | -1.17 | 29.30 | - |
| 70.00-74.99 |
| | n | 50 | | | 36 | | | 149 | |
| Body weight (kg) | 66.60 | 12.80 | 6.35 | 72.95 | 11.93 | 8.85 | 64.10 | 11.60 |
| Body height (cm) | 157.00 | 0.05 | 1.58 | 158.58 | 7.51 | 8.48 | 150.10 | 6.10 |
| BMI (kg/m2) | 26.90 | 4.50 | 2.10 | 29.00 | 4.25 | 0.55 | 28.45 | - |
| 75.00-79.99 |
| | n | 34 | | | 27 | | | 134 | |
| Body weight (kg) | 61.20 | 10.60 | 10.30 | 71.50 | 16.43 | 9.50 | 62.00 | 12.40 |
| Body height (cm) | 154.00 | 0.06 | 3.28 | 157.28 | 4.56 | 7.88 | 149.40 | 6.50 |
| BMI (kg/m2) | 26.90 | 4.50 | 2.01 | 28.91 | 6.85 | 1.14 | 27.77 | - |
| 80.00-84.99 |
| | n | 38 | | | 18 | | | 87 | |
| Body weight (kg) | 59.20 | 12.20 | 6.18 | 65.38 | 9.62 | 6.88 | 58.50 | 11.60 |
| Body height (cm) | 154.00 | 0.05 | 1.83 | 155.83 | 6.70 | 8.13 | 147.70 | 6.00 |
| BMI (kg/m2) | 26.90 | 4.50 | -0.05 | 26.85 | 3.18 | 0.04 | 26.81 | - |
Note: Santos et al. [31] do not present BMI values and therefore we determined this characteristic based on the presented data, and do not present the standard deviation of the BMI value.
Results which are presented by Delarue et al. [30] predicate lower body height and lower weight in French females in comparison to Czech females. We reached the same conclusions even in comparison to Santos et al. [31]. However, this comparison seems problematic and inappropriate with regard to a different ethnic group. Only the BMI characteristic can be used. BMI values predicate the expressive overweight state of Czech females in comparison to results by Delarue et al. [30]. In comparison with Santos et al. [31] we find lower BMI in the first age categories which, when increased by age, is detrimental to Czech females.
Body height is the basic morphological parameter in which changes can be easily monitored. De Groot et al. [22] presents the decline of body height in the senior set (entry age 70–75 years) by 1.5–2.0 cm per decade. If we compare the results with the above-mentioned study, we can conclude that the decrease of body height was substantially more rapid in the monitored group. The mean decline was 1.96 cm in 5 years, whereas a significant difference is found between sub2 and sub3 (reduction by 3.48 cm). Spirduso et al. [7] point out the acceleration of body height decrease after the age of 60. It prompts the question whether the decrease of body height in the monitored sample can be considered as a result of acceleration or it is influenced by other factors. Apparent postural changes which include hyperkyphosis and kyphoscoliosis occur in seniors. In the case of females with diagnosed osteoporosis the support locomotor apparatus can be affected even more significantly. Acceleration of body height decrease does not necessarily have to be caused by the speed of involution changes but factors participating in the change of body height must be considered. We have not paid attention to this issue in terms of our presented study.
Body composition changes throughout life and it is influenced by genetic and exogenous factors. Changes of body composition occur with increasing age in terms of the reduction of fat-free mass and an increase of fat component. The mean FFM value is 43.69 kg in the monitored group and the amount of body fat corresponds to 27.52 kg. In comparison to the results from Kyle et al. [17], who monitored body composition in females aged 60–98 years, the representation of FFM and body fat is relatively higher. Those differences can be explained by the different body weight which was, in the case of the monitored group, on average 8.1 kg higher. However, this difference is mostly due to body fat (5.22 kg), which we identify as undesirable. We reached a similar conclusion when comparing the results from Schutz et al. [19].
The concept of FFMI and BFMI enables the preliminary assessment of sarcopenia. If the FFMI value is too low, a reduction of muscle mass occurs and it is a sign of sarcopenia. In our case the mean FFMI value was in the zone which predicates a good health state and completely excludes sarcopenia. However, the evaluation is preliminary and it would require more detailed analysis. In this case the BFMI values are above the upper threshold of the optimal zone in all age categories, and they predicate a relatively high representation of body fat and thus a higher risk of overweight and obesity. This statement corresponds with BMI values, which exceeded the upper threshold of the health safety zone in all cases.
A number of changes (morphological and functional) in females are induced by the reduced secretion of sex hormones which occurs in the climacteric period. In terms of body composition we can observe an acceleration of body fat deposition and its redistribution. A number of scientific publications deal with this issue [23, 32, 33]. The BFMI values signal a relatively high representation of body fat and therefore we analysed this body component in detail and we focused on its distribution. Our results conform to the above-mentioned studies and confirm the tendency for re-distribution of the fat component after menopause. The WHR index suggested distribution of body fat in the abdominal area. Clasey et al. [34] consider the WHR index as adequate for evaluation of abdominal obesity but the visceral fat value has a higher predictive value for determination of a higher relative risk of occurrence of health problems. In the case of the monitored group the amount of visceral fat was far above the optimal threshold and it had a tendency to rise with increasing age. Our results are in compliance with the statement of Elia [24], who describes the age-related rise of intra-abdominal fat as significantly related to the risk of cardiovascular co-morbidity and mortality.
The study has been supported by the research grant from the Ministry of Education, Youth and Sport of the Czech Republic (No. MSMT 6198959221) "Physical Activity and Inactivity of the Inhabitants of the Czech Republic in the Context of Behavioural Changes”.
Piśmiennictwo
1. Robine JK & Vaupel JW: Supercentenarians: slower aging individuals or senile elderly? Experimental Gerontology, 2001; 36: 915-930. 2. Robine JK & Vaupel JW: Emergence of supercentenarians in low-mortality countries. North American Actuarial Journal, 2002; 6(3): 53-64. 3. Kalvach Z et al.: Geriatrie a gerontologie. Praha: Grada, 2004. 4. Burcin B, & Kučera T: Perspektivy populačního vývoje České republiky na období 2003–2065. Praha: Demo Art. 2003. 5. Czech Statistical Office (2004). Projekce obyvatelstva České republiky. Retrieved 21. 1. 2008 from the World Wide Web: http://czso.cz/csu/2004edicniplan.nsf/t/B0001D6145/$File/4025rra.pdf 6. Shephard RJ(Eds.): Gender, physical activity, and aging. London: CRC Press, 2002. 7. Spirduso WW, Francis KL, & Macese PG (2005). Physical Dimensions of Aging (2nd ed.). Champaign, IL: Human Kinetics. 8. European Commission (2006). Special Eurobarometer – Health and food. Retrieved 25. 1. 2008 from the World Wide Web: http://ec.europa.eu/health/ph_publication/eb_food_en.pdf 9. Schuit AJ: Physical activity, body composition and healthy ageing. Science & Sports, 2006; 21(4): 209-213. 10. World Health Organization (2002). The World Health Report 2002. Reducing Risks, Promoting Healthy Life. Geneva: World Health Organization. 11. Wendel-Vos, GC: Physical activity and stroke. A meta-analysis of observational data. International Journal of Epidemiology, 2004; 33(4): 787-798. 12. Gale T (2002). Gale Encyclopedia of Medicine – Vol. 4 (2nd ed.). Farmington Hills, MI: Gale Group. 13. Hlúbik P: Obezita – nemoc, rizikový faktor. Interní medicína pro praxi. 2002; 8: 396-398. 14. Shephard RJ: Aging, physical activity, and health. Champaign, IL: Human Kinetics, 1997. 15. Apovian C.M, Frey C M, Wood GC, Rogers JZ, Still CD, & Jensen GL: Body Mass Index and Physical Function in Older Women. Obesity Research, 2002; 10: 740-747. 16. World health organization (2007). The challenge of obesity in the WHO European Region and the strategies for response. Retrieved 29. 1. 2008 from the World Wide Web: http://www.euro.who.int/document/E90711.pdf 17. Kyle UG et al.: Aging, physical activity and height-normalized body composition parameters. Clinical Nutrition, 2003; 23(1): 79-88. 18. Kyle UG, Morabia A, Schulz Y, & Pichard C: Sedentarism affects body fat mass index and fat-free mass index in adults aged 18 to 98 years. Nutrition. 2004; 20: 255-260. 19. Schutz Y, Kyle U & Pichard C: Fat-free mass index and fat mass index percentiles in Caucasians aged 18–98 y. International Journal of Obesity, 2002; 26: 953–960. 20. Greenberg JA: Biases in the mortality risk versus body mass index relationship in the NHANES–1 Epidemiologic Follow-up Study. International Journal of Obesity, 2001; 25(7): 1071-1078. 21. Heyward VH & Wagner DR: Applied Body Composition Assessment. Champaign, IL: Human Kinetics, 2004. 22. de Groot CP et al.: Ten-year changes in anthropometric characteristics of elderly Europeans. Journal of Nutrition, Health & Aging, 2002; 6(1): 4-8. 23. Poehlman ET: Menopause, energy expenditure, and body composition. Acta Obstetricia et Gynecologica Scandinavica, 2002; 81: 603-611. 24. Elia M: Obesity in the Elderly. Obesity Research, 2001; 9(4): 244-248. 25. Baumgartner RN et al.. Epidemiology of sarcopenia among the elderly in New Mexico. American Journal of Epidemiology, 1998; 147(8): 755-763. 26. Moulias R, Meaume S & Raynaud-Simon A: Sarcopenia, hypermetabolism, and aging. Zeitschrift für Gerontologie und Geriatrie, 1999; 32(6): 425-432. 27. Příhoda V: Ontogeneze lidské psychiky – díl 4. Praha: Státní pedagogické nakladatelství, 1974. 28. Vivian HH & Dale RW: Applied Body Composition Assessment (2nd ed.). Champaign, IL: Human Kinetics, 2004. 29. Biospace (2008). InBody 720 – The precision body composition analyzer. Retrieved 25. 10. 2008 from the World Wide Web: https://www.e-inbody.com/product/pdf/720_catalog_10P_eng.pdf 30. Delarue J et al.: Anthropometric values in an elderly French population. British Journal of Nutrition, 1994; 71: 295-302. 31. Santos JL et al.: Anthropometric measurements in the elderly population of Santiago, Chile. Nutrition 2004; 20: 452-457. 32. Okura T et al.: Relationships of Resting Energy Expenditure with Body Fat Distribution and Abdominal Fatness in Japanese Population. Journal of Physiological Anthropology, 2002; 25: 22(1), 47-52. 33. Toth MJ et al.: Effect of menopausal status on body composition and abdominal fat distribution. International Journal of Obesity, 2000; 24: 226231. 34. Clasey JL et al.: The use of anthropometric and dual-energy X-ray absorptiometry (DXA) measures to estimate total abdominal and abdominal visceral fat in men and women. Obesity Research, 1999; 7: 256-264.
