© Borgis - New Medicine 4/2008, s. 89-93
*Petr Kutáč1, Vojtěch Gajda1, Miroslava Přidalová2, Vít Šmajstrla3
Validity of Measuring Body Composition by Means of the BIA Method
1Centre of Human Motion Diagnostics – Department of Physical Education, Pedagogical Faculty of Ostrava University in Ostrava, Czech Republic
Head of Department: Doc. PhDr. Vojtěch Gajda, CSc.
2 Department of Functional Anthropology and Physiology, Faculty of Physical Culture, Palacký University, Olomouc, Czech Republic
Head of Department: Prof. RNDr. Jarmila Riegerová, CSc.
3 Bormed Health Centre (Osteocentre), Ostrava, Czech Republic
Head of Department: MUDr. Vít Šmajstrla
Summary
Introduction. Body composition represents a significant diagnostic data item regarding the process of training. It also plays a role when we focus on health-based skills.
Aim. The aim of this study is to verify the validity of measuring body composition by means of the BIA method and to compare the results obtained with the results gained by means of the DEXA method. Two measurement modes (standard and athletic) have been considered.
Materials and methods. The group investigated consisted of 74 individuals (45 males, 29 females). The average age was 20.2 (males) and 19.5 (females). The DEXA method and BIA method were applied to measure body composition. So as to assess the validity of measurements the regression functions model was used. A level of significance α = 0.05 was applied to all statistical tests.
Results. The acquired value of the Pearson correlation was r = 0.753 (females) and r = 0.837 (males – athletic mode) and r = 0.817 (males – standard mode). The value dmax = ± 2 sy/x was found to be ± 4.42% for females, and ± 2.38 for males (athletic mode) and ± 3.40 for males (standard mode), which is an error of objective significance.
Conclusion. The relatively high coefficient of correlation r cannot be considered as a guarantee of accurate measurements. When considering the accuracy of measurements, it is necessary to base the judgment on the value of dmax. It is not possible to combine the applied methods and to compare the acquired results with each other.
Introduction
Present studies dealing with body composition focus on a representation of particular body fractions [1] concerning mainly the proportion of the lipoid fraction and the muscular fraction. Factors which have an essential influence on body composition are: motion activity and the choice of physical training. This is why information regarding body composition is considered to be a significant diagnostic item of the training process [2, 3, 4, 5, 6, 7, 8, 9]. The most investigated factor is the value of body fat, as it is known that an extremely high value leads to a decrease in athletic efficiency in many athletic activities.
Body composition represents one of the most important components of health-based abilities, as it relates to nutrition and the state of health of each individual [10, 11, 12, 13]. Data concerning body composition are used in medicine (diabetology, obesitology and osteoporosis diagnostics and treatment) [14, 15, 16, 17].
Various methods are used to estimate the fat fraction in body composition. These methods differ in the demands of professional servicing, organization (amount of time) and financial costs. The most frequently used methods are bioelectrical impedance analysis (BIA) and dual energy X-ray absorptiometry (DEXA). The principle of the BIA method is based on the differing electrical impedance when an electrical current of low intensity is passed through various biological structures, i.e. the principle of the different electrical features of tissues, fat and body water [18, 19]. The DEXA method, which is considered to be the "gold standard”, uses the difference in X-ray absorption when two X-ray beams with differing energy levels are passed through the body. [20, 21, 18]
If the DEXA method is regarded to be more reliable [22], its results can serve as an empiric criterion for verification of the validity of other methods. Our paper deals with the BIA method. We used the Tanita BC-418 MA device. Although a number of studies have been published in this field, we did not manage to find any comparison of the tetrapolar weight Tanita and the measurement modes (standard and athletic). In those studies other devices are also used (Quadscan, Tanita BIA 101 SC, Tanita TBF-300A). However, these do not enable the measurement mode to be chosen.
Aim
The aim of this study is to verify the validity of measuring body composition by means of the BIA Method (Tanita BC-418 MA device) and to compare the results obtained with the results acquired by means of the DEXA method. Two measurement modes (standard and athletic) have been considered.
Materials and methods
The group investigated consisted of 74 university students of Physical Education and Sports at the Pedagogical Faculty of Ostrava University (45 males, 29 females). The average age was 20.2 (males) and 19.5 (females). To find out the body composition by means of the DEXA method, a third generation Denzitometer Holgic QDR was used. Results were also found by means of the BIA method, using the tetrapolar bioimpedance weight Tanita BC-418 MA. All the measurements of a subject were taken on the same day. The data concerning the amount of physical activity of the individual tested were acquired from a record of his/her physical activity over one week. [25].
To evaluate the validity of the BIA method, we used the modelling of the relationship between the variables investigated by means of various models of regression functions. The independent variables were represented by the Tanita (athletic and standard measurement modes) and the dependant variables by the DEXA method. When verifying the mode of Tanita measurements, we followed the manufacturer´s recommendations, which means that the choice of mode depends on the amount of physical activity (less than 10 hours/week – STANDARD, more than 10 hours/week – ATHLETIC).
The statistical processing was done by means of the statistics program SPSS 16.0. All statistical tests were carried out at a level of significance α = 0.05.
Results
Considering the fact that none of the women exceeded the limit of 10 hours per week of physical activity, we used the Tanita standard mode for comparison with the results of DEXA. Table 1 presents the basic characteristics of measurements of the percentage of fat in the body composition of females.
Table 1. Basic characteristics of measurements – females.
| DEXA
% fat | Tanita
% fat |
| n | 23 | 23 |
| M | 24.92 | 23.60 |
| SD | 3.36 | 4.32 |
| skewness | .097 | -.362 |
| kurtosis | -.293 | .783 |
| min | 18.72 | 14.10 |
| max | 32.10 | 32.90 |
n – frequency, M – mean, SD – standard deviation
A normal distribution is expected in a majority of human organism characteristics. We verified them by Kolmogorov-Smirnov and Shapiro-Wilk tests in both measurements. They did not reject the hypothesis of a normal distribution in the basic group (Physical Education female students).
For an estimation of the regression function we used linear, quadratic, logarithmic and exponential models and their R square is in Table 2. All indices of regression are statistically significant, but the Tanita measurement explains the dispersion of the DEXA measurement of females in normal mode of approximately 60%. None of the chosen regression functions creates significantly better conditions for criterion estimation.
Table 2. R Square of the chosen regression functions – female.
| Linear | Quadratic | Logarithmic | Exponential |
| I2yx | .567 | .569 | .556 | .585 |
I2xy - R Square
For a better illustration we present the graphical expression of empirical values by chosen models of regression functions (Figure 1).
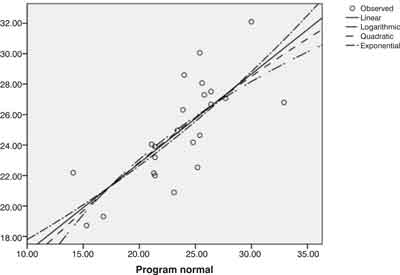
Fig. 1. Graphs of the selected regression functions of Dexa estimate from the Tanita - mode Standard (females)
If we ask whether there is empirical validity of body composition measured by the Tanita BC 418 MA compared with the DEXA measurement, then we get a Pearson correlation r = 0.753 from the previous results.
Standard error of estimate (Sy/x = SEE) (measured by DEXA) was 2.21%. The value of dmax = ± 2 sy/x was ± 4.42%.
It was possible to divide the group of males into groups which fulfil the requirements of the athletic and standard mode. Basic descriptive characteristics of all measurements are in Table 3.
Table 3. Basic characteristics of measurements – males.
| | Males - over 10 hours/week | Males - below 10 hours/week |
| DEXA | TANITA (athletic) | DEXA | TANITA (standard) |
| n | 14 | 14 | 31 | 31 |
| M | 11.53 | 11.10 | 13.13 | 11.88 |
| SD | 2.93 | 3.55 | 4.65 | 4.42 |
| skewness | .505 | .086 | 1.186 | .406 |
| kurtosis | -1.197 | -1.186 | -1.045 | -.863 |
| min | 8.18 | 5.60 | 7.02 | 6.00 |
| max | 17.13 | 16.50 | 26.70 | 20.90 |
In the process of the verification of normality in the division of the values measured, both methods proved the normality in the division of the Tanita results, regardless of the mode used for processing the results. When using the DEXA method, the normality of the division of the results showed a significant skewness to the right. We presume that the DEXA measurements represent reality better because it can be legitimately presupposed that physical education students have less fat than the ordinary population.
For the estimation of the regression function we used the same regression models as in the first example. From the selected regression functions shown in Table 4, the quadratic model creates the best conditions for estimation since it explains the biggest part of the dispersion of the estimated values (approximately 63% and 79%).
Table 4. R Square of selected regression functions.
| | Linear | Quadratic | Logarithmic | Exponential |
| Males over 10 hours a week | athletic | I2yx | .367 | .628 | .263 | .363 |
| athletic corr. | .701 | .741 | .644 | .711 |
| standard corr. | .501 | .647 | .420 | .514 |
| Males below 10 hours a week | standard | I2yx | .667 | .791 | .573 | .657 |
l2xy - R Square
Due to the small sample of males with over 10 hours of physical activity a week, the result was influenced by an isolated case of a respondent/subject. As a result, this respondent was eliminated from the above-mentioned sample (athletic corr.).
The sample of males with over 10 hours of physical activity a week was significantly smaller than the sample of males with below 10 hours of physical activity a week. It is necessary to consider that an isolated case of one respondent in the small sample of men with over 10 hours of physical activity a week could have influenced the parameters of the division of the variables significantly. Even though the testing of maximum deviations from variables did not show positive results, the graphic view of their dependence revealed very different results for one respondent. After eliminating this respondent, the results recorded under the heading athleticcorr. were obtained. These results indicate the convergence of the regression models used.
At this point it was possible to compare the results from the two modes – standard and athletic – as the results from the normal mode had already been recorded. It may be said that only in the quadratic model was there no significant decrease in the value ( standard corr.). The verification of the influence of the selected evaluation mode on the results obtained from the Tanita device may be needed in order to verify findings related to the practical use of the device.
The empirical validity of measuring body composition using the Tanita BC 418 MA device for measuring DEXA is compiled in Table 5. The values were computed on the basis of a corrected set (DEXA: M= 11.33; SD = 2.94).
Table 5. Characteristics of the empiric validity of measuring through the Tanita BC 418 MA.
| mode | r | s Y/x
(%) | dmax
(%) |
| Males over 10 hours a week | athleticopr | .837 | 1.19 | 2.38 |
| Males below 10 hours a week | standard | .817 | 1.70 | 3.40 |
r – Pearson correlation, sY/x – standard error of estimate dmax = ± 2 sy/x
Discussion
The Pearson correlation coefficient is relatively high (r> 0.8). This explains more than 64% of the dispersion, so the results obtained through the Tanita device could be regarded as valid in relation to DEXA. However, the dmax values of ± 4.42% for the fat component in females and ± 2.38 and 3.40 for the fat component in males are high in order to provide for the criteria estimation. This error of measurement appears to be significant in relation to the changes in body composition which need to be recorded. The obtained scale of values around the criteria estimation can result in the wrong placement of a person into a group when using the Standard percentage of the fat component [26, 21]. It may also mean an incorrect deduction of health risks. This deviation is also considered as significant by other researchers in the field of sport. It is usually stated that the fat component for sportspersons is most frequently between 2 and 5% [27, 28, 29, 30, 2]. As mentioned before, the size of a selected sample has a significant influence on the results gained by statistical computations. In the case of a small sample an isolated case of a respondent can have a significant influence on the parameters of the division of the studied variables. This situation occurred in the sample of men with over 10 hours of physical activity a week. After eliminating that person from the sample different results were obtained (athletic corr.). The value of the models used then converged (0.741 and 0.791) and significantly surpassed the original 64% dispersion of the empirical values of the criteria estimation.
The values of the maximum deviation in the criteria estimation indicate the differences in assessing the fat component by using the two methods. We also suggest that these methods should not be combined with each other. This finding corresponds with the findings of other research workers who dealt with similar issues using other bioimpedance devices [22, 31, 20, 24].
It is obvious that our results could have been influenced by the selected sample of respondents: firstly, by its size (as mentioned before); secondly, by its homogeneity, related to the fact that the respondents were all first year students studying physical education and sport. As part of their courses these students are required to do a certain amount of sport. They have also done a lot of physical activity before they begin their courses.
Conclusion
In spite of the fairly high value of the Pearson correlation it is necessary to state that due to the findings obtained by means of the DEXA method and those obtained by the bioimpedance method (TANITA 418 MA), it is not possible to estimate with sufficient accuracy the values of DEXA from the Tanita measurements. The results are heavily loaded in a high value of dmax (± 2 sy/x). It is clear that the data given by the producer are loaded with ambiguity as only the value of the Pearson correlation (in relation to DEXA) is stated, without any other specific characteristics. Another limiting factor of our findings was the small sample of respondents.
In conclusion, the specification of body composition is dependent on the method used, and therefore it is not possible to combine different methods with each other. Our investigation has shown that the findings obtained by using different methods can be compared only with great difficulty. It is recommended to carry out repeated measurements using the same method all the time.
Piśmiennictwo
1. Riegerová J, Přidalová M, Ulbrichová M: Aplikace fyzické antropologie v tělesné výchově a sportu (příručka funkční antropologie). Olomouc, Hanex 2006. 2. Soric M, Misigoj-Durakovic M, Pedisic Z: Dietary Intake and Body Composition of Prepubescent Female Aesthetic Athletes. International Journal of Sport Nutrition & Exercise Metabolism, 2008; 18: 343-354. 3. Fruth J, Morgan A, Darby L, Tobar D: Evaluation of three skinfold equations by using the bod pod as the criterion in Caucasian female athletes. Journal of Exercise Physiology, 2008; 11: 28-37. 4. Williams AG, Wilkinson M: Simple anthropometric and physical performance test to predict maxima box – lifting ability. Journal of Strength & Conditioning Research, 2007; 21: 638-642. 5. Vasques DG, de Fátima da Silva Duarte M, da Silva Lopes A: Brazilian Journal of Kineanthropometry & Human Performance, 2007; 9: 127-133. 6. Rahimi R: Effect of moderate and high intensity weight training on the body composition of overweight men. Facta Universitatis: Series Physical Education & Sport, 2006; 4: 93 - 101 7. Neuymayer G: Physical and Physiological Factors Associated with Success in Professional Alpine Skiing. International Journal of Sports Medicíně, 2003; 24: 571-575. 8. Colombo M: Alpine skiiand body mass. Rigidita di Kultura Spletiva, 2002; 21: 59-63. 9. White AT, Jonson SC: Physiological aspect and injury in elite Alpine skiers. Sports. Med. 1993; 15: 170-178. 10. Lohman T et al.: Relationships among Fitness, Body Composition, and Physical Activity. Medicine & Science in Sports & Exercise, 2008; 40: 1163-1168. 11. Buyukyazi G: The effects of eight-week walking programs of two different intensities on serum lipids and circulating markers of collagen remodelling in humans. Science & Sports, 2008; 23: 162-168. 12. Buffart LM, Van Den Berg-Emons RJG, Van Wijlen-Hempel MS, Stam HJ, Roebroeck ME: Health-related physical fitness of adolescents and young adults with myelomeningocele. European Journal of Applied Physiology, 2008; 103: 181-188. 13. Carrel AL et al.: Measuring aerobic cycling power as an assessment of childhood fitness. Journal of Strength & Conditioning Research, 2007; 21: 685-688. 14. Pravn P et al.: Low Body mass Is an Important Risk Factor for Low Bone Mass and Increased Bone Loss in Early Postmenopausal Women. Journal of Bone and Mineral Research, 1999; 14: 1622-1627. 15. Parikh SJ et al.: The Relationship between Obesity and Serum 1,25 – Dihydroxy Vitamin D Concentrations in Healthy Adults. The Journal of Clinical Endocrinology & Metabolism, 2004; 89: 1196-1199. 16. Misra M et al.: Alterations in Growth Hormone Secretory Dynamics in Adolescent Girls with Anorexia Nervosa and Effects on Bone Metabolism. The Journal of Clinical Endocrinology & Metabolism, 2003; 88: 5615-5623. 17. Plujim SMF et al.: Determinants of Bone Mineral Density in Older Men and Women: Body Composition as Mediator. Journal of Bone and Mineral Research, 2001; 16: 2142-2151. 18. McArdle W D, Katch FI, Katch VL: Exercise Physiology. Energy, Nutrition, & Human Performance. Philadelphia, Lippincott Williams & Wilkins 2007. 19. Heymsfield SB et al.: Human Body Composition. Champaign, IL, Human Kinetics 2005. 20. Stewart AD, Hannan WJ: Prediction of fat and fat-free mass in male athletes using dual X-ray absorptimetry as the reference method. Journal of Sports Science, 2000; 18: 263 – 274. 21. Heyward VH, Wagner DR: Applied body composition assessment. Champaign, IL, Human Kinetics 2004. 22. De Lorenzo A et al.: Body composition measurement in highly trained male athletes: a comparison of three methods. Journal of Sports Medicine & Physical Fitness, 2000; 40: 178-183. 23. Kilduff LP et al.: Reliability and detecting change following short-term creatine supplementation: comparison of two-component body composition methods. Journal of Strength & Conditioning Research, 2007; 21: 378-384. 24. Wilmerding MV, Gibson AL, Mermier CM, Bivins KA: Body composition analysis in dancers: methods and recommendations. Journal of Dance Medicine & Science, 2003; 7: 24 -31. 25. Frömel K, Novosad J, Svozil Z: Pohybová aktivita a sportovní zájmy mládeže. Olomouc, Univerzita Palackého1999. 26. Lohman TG: Advances in Body Composition Assessment. Champaign, IL, Human Kinetice 1992. 27. Norton KI, Craig NP, Withers RT, Whitingham NO: Assessing the body fat of athletes. Australian Journal of Science & Medicine in Sport, 1994; 26: 6-13. 28. Bunc V, Psota R: Physiological profile of very young soccer players. Journal of Sports Medicine & Physical Fitness, 2001; 41: 337-341. 29. Dostálová I, Přidalová M, Kudrna Z: Evaluation of body constitution and body fractions of water polo players. Slovenská antropológia, 2005; 8: 46-49. 30. Bandyopadhyay A: Body Composition, Hematological Profiles and Cardiorespiratory Fitness in Female Swimmers of West Bengal, India. International Journal of Applied Sports Sciences, 2008; 20: 10-21. 31. Clark RR et al.: Minimum Weight Prediction Methods Cross – Validated by the Four-Component Model. Medicine & Science in Sports & Exercise, 2004; 36: 639-647.
