Inclusion criteria were: a) SAH proven by CT examination to have occurred within the previous 24 hours from admission, b) 80 years=age=17 years, c) good clinical condition (Glasgow Coma Score=12, Hunt and Hess grade
Subjects with a history of previous stroke or with known cerebral infarcts, renal failure, cardiac failure, severe diabetes mellitus, Parkinson´s disease, Alzheimer´s dementia, epilepsy or other neurologic or psychiatric disorders were excluded.
Clinical and laboratory investigation
Patients had a routine laboratory work-up, which included repeated blood tests and CT examinations. The amount of blood in the subarachnoid space was graded according to the Fisher scale. The patients´ clinical condition on admission was graded according to the Hunt and Hess scale (H&H) and the Glasgow Coma Score (GCS). Neurological status was carefully assessed daily during hospitalization. Digital subtraction angiography (DSA) was performed within the first 2 days after admission in most of them, or later (after day 14) if the patient´s clinical condition did not permit it. If DSA failed to reveal an aneurysm, a second DSA was performed two weeks later. Whenever an aneurysm was demonstrated on the first or second DSA, surgery (clipping) was conducted. In 4 occasions endovascular treatment (coiling) was attempted. Vasospasm was assumed on a clinical basis if deterioration of consciousness, increase in body temperature or new neurological deficit developed at least 3 days after SAH, which could not be explained by electrolyte or metabolic disturbances, hydrocephalus or re-bleeding. When a new neurological deficit occurred after surgery, it was attributed to vasospasm only if it was detected 48 hours or more after craniotomy, and if it could not be explained otherwise.
Patients who developed severe hydrocephalus acutely after SAH or post-operatively were treated with ventricular-peritoneal shunting. The final outcome was assessed 6 months after SAH and was graded according to the Glasgow Outcome Scale (GOS) (Table I).
Table I. Demographic data and values of Hunt-Hess (H-H), single photon emission computed tomography/ summed perfusion defect score (SPECT/SPDS), neuro-specific enolase (NSE), Glasgow Coma Score (GCS) groups and Glasgow Outcome Score (GOS) on admission to hospital.
| | Clinical status of patients on admission | |
| Patients | Sex | Age | H-H | NSE | SPECT/SPDS | GCS | GCS/Groups | GOS |
| 1 | F | 64 | 2 | 18.2 | 16 | 12 | 3 | 3 |
| 2 | M | 72 | 2 | 12.1 | 10 | 14 | 2 | 5 |
| 3 | F | 71 | 2 | - | 10 | 14 | 2 | 3 |
| 4 | F | 59 | 2 | - | 1 | 15 | 1 | 5 |
| 5 | M | 51 | 2 | - | 5 | 15 | 1 | 5 |
| 6 | M | 69 | 2 | 18.4 | 19 | 10 | 3 | 1 |
| 7 | F | 74 | 1 | - | 14 | 12 | 3 | 1 |
| 8 | F | 52 | 1 | 10.3 | 7 | 15 | 1 | 5 |
| 9 | M | 45 | 2 | 29.0 | 11 | 14 | 2 | 1 |
| 10 | F | 60 | 3 | 9.7 | 9 | 13 | 2 | 4 |
| 11 | F | 65 | 1 | - | 19 | 12 | 3 | 3 |
| 12 | M | 60 | 1 | - | 5 | 15 | 1 | 5 |
| 13 | M | 53 | 2 | - | 15 | 12 | 3 | 4 |
| 14 | M | 40 | 3 | 16.6 | 17 | 13 | 2 | 3 |
| 15 | F | 52 | 2 | 16.8 | 17 | 12 | 3 | 3 |
| 16 | F | 60 | 2 | 9.2 | 7 | 15 | 1 | 5 |
| 17 | M | 80 | 3 | 36.8 | 15 | 11 | 3 | 1 |
| 18 | F | 60 | 1 | - | 20 | 12 | 3 | 4 |
| 19 | F | 55 | 2 | 6.2 | 1 | 15 | 1 | 5 |
| 20 | F | 56 | 2 | 13.5 | 13 | 12 | 3 | 5 |
| 21 | M | 59 | 2 | 9.1 | 22 | 12 | 3 | 1 |
| 22 | M | 57 | 2 | - | 4 | 15 | 1 | 5 |
| 23 | M | 17 | 2 | 15.3 | 12 | 14 | 2 | 5 |
| 24 | F | 62 | 2 | 11.0 | 3 | 15 | 1 | 5 |
| 25 | M | 70 | 2 | 9.8 | 13 | 15 | 1 | 5 |
| 26 | F | 38 | 2 | 10.1 | 2 | 15 | 1 | 5 |
| 27 | F | 53 | 2 | - | 14 | 14 | 2 | 3 |
| 28 | M | 47 | 2 | - | 7 | 15 | 1 | 5 |
| 29 | F | 46 | 2 | - | 4 | 15 | 1 | 5 |
| 30 | F | 47 | 2 | 14.5 | 1 | 15 | 1 | 5 |
| 31 | M | 75 | 3 | 11.9 | 7 | 15 | 1 | 4 |
| 32 | M | 69 | 2 | 7.7 | 5 | 15 | 1 | 4 |
| 33 | M | 32 | 2 | 9.3 | 13 | 15 | 1 | 5 |
| 34 | F | 69 | 2 | 16.2 | 17 | 12 | 3 | 5 |
| 35 | M | 68 | 2 | 16.0 | 12 | 15 | 1 | 4 |
SPECT perfusion imaging
Scintigraphic studies were performed within the first 5 days after admission (mean 3.4, median 3 days). Technetium-99m ethyl-cysteinate dimmer (99mTc-ECD, Neurolite, Bristol-Myers Squibb Pharm, Belgium) was reconstituted from a lyophilized commercial kit, according to the manufacturer´s instructions. 740 MBq (20mCi) of the formulation were administered through an intravenous line previously inserted. The patient was instructed to remain calm, with eyes closed, in a quiet, semi-dark room for the next 30 minutes after injection. Imaging took place 30-45 minutes after injection. A dual-head gamma camera (Helix, El Scint, Israel), equipped with a parallel-hole, low energy, high-resolution collimator, was used. A specific head-holder, provided by the manufacturer, was added to the imaging table in order to prevent movement and to minimize the distance between the heads of the camera and the patient´s head. Acquisition parameters were as follows: 120 projections (60 for each head) over an angular range of 360°, step and shoot mode, 30 seconds per step, body contour orbit, 128x128 matrix size, zoom 1.5. Raw images were pre-filtered with a Butterworth filter, order 10, critical frequency 0.5, and subsequent tomography back-projection reconstruction was accomplished by Ramp filtering. Attenuation correction with Chang´s method was applied to the tomography slices, with a coefficient of 0.11 cm-1. Transverse, sagittal and coronal slices were re-oriented to the orbito-meatal axis. Transverse slice thickness was approximately 0.4 cm. Transverse slices were positioned in relation to the bicommissural plane and coronal slices were positioned perpendicular to the transverse plane [10, 11] (Figure 1, Figure 2).
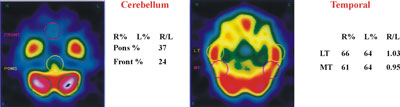
Fig. 1. 99mTc-ECD single photon emission computed tomography (SPECT transverse slices). Images of cerebellum as reference structure for SPECT semi-quantitative analysis. Images of the lateral temporal and middle temporal in transverse slices.
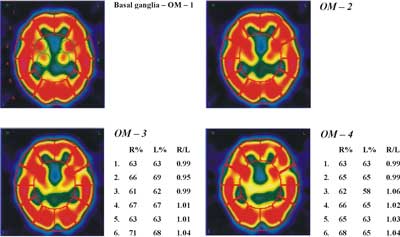
Fig. 2. 99mTc-ECD single photon emission computed tomography (SPECT – transverse slices). Images of the basal ganglia and cerebral in 4 different transversal levels (OM-1-2-3-4).
Quantification of SPECT imaging
Quantitative expression of SPECT findings was accomplished by semi-automated computer software. Counts over cerebral regions were normalized to the cerebellar maximum activity. A number of regions of interest (ROIs), mirrored around the midline, were automatically drawn on 6 manually selected transverse slices to encompass cortical and sub-cortical structures, as follows: two ROIs over the cerebellum, 1 ROI over the brain stem, 4 over the basal ganglia, 4 over the temporal cortex (medial and lateral) and an additional 48 ROIs over the cerebral cortex (Figure 1, Figure 2).
The cerebellum is used in this study as a reference structure. This is because the cerebellum stays uninvolved when compared with all the other grey and white matter structures in the brain. CT scan ruled out the possibility of cerebellar pathology [12].
The correct position of the automatic ROIs was manually re-adjusted. The right-to-left ratio as well as the percentage of counts relative to the cerebellum were calculated for each region. A left-to-right ratio smaller than 0.95 or greater than 1.05 was considered abnormal. A relative percentage smaller than 60% of cerebellar counts was similarly considered abnormal, with the exception of medial occipital cortex and basal ganglia, where the cut-off of abnormal finding was set at 80% and 50% respectively. Summing of ROIs yielded a final score of ischaemia: summed perfusion defect score (SPDS) for each SPECT study (Table 1). SPECT findings of the present study were further graded as grade 1=normal (SPDS <9), grade 2=mildly-moderately abnormal (9ŁSPDSŁ16) and grade 3=severely abnormal (SPDS>16).
Statistics
Using the aforementioned criteria, ROC analysis of data derived from the database of our institution has shown that a SPDS cut-off of 9 could best discriminate abnormal subjects (those with neurological deficit or with GCS<15) from controls with 95% sensitivity, 95% specificity and 95% accuracy. The correlation between sets of numerical and ordinal data, such as SPDS and H&H grade, or GCS, or Fisher scale, or GOS was evaluated by the rank correlation (Spearman´s rank regression) method. Differences of SPDS among different patient groups (e.g. those with or without vasospasm, and those with or without favourable outcome) were tested with the Mann-Whitney U test. On this occasion, all variables were expressed in a binary manner (e.g. low/high H&H grade, positive/negative SPECT, yes/no vasospasm, favourable/unfavourable outcome, etc).
In all analyses, p <0.05 was considered significant. Continuous variables are presented as mean ± SD.
Results
Relation between SPECT on admission and the Glasgow Outcome Scale (GOS)
Our results do not exhibit any significant correlation between SPECT/SPDS and GOS values (Figure 3). Given the justifiable interest of finding even a subtle indication of correlation, we classified the patients into two groups according to their SPECT values (A: 17 patients with SPECT/SPDS Ł10; and B: 18 patients with SPECT/SPDS>10) in order to find out if these groups give statistically significant differences in their corresponding GOS values.
Fig. 3. The graph shows two distinct single photon emission computed tomography/ summed perfusion defect score (SPECT/SPDS) regions: A with SPECT/SPDS Ł10 (u) and B with SPECT/SPDS>10 (n). Groups A and B differ significantly in their Glasgow Outcome Score (GOS) values (Mann-Whitney U test, a = 0.05).
We applied the Mann-Whitney non-parametric test using Instate+ for Windows at a significance level of p<0.05 and found that patients with SPECT/SPDS Ł10 give a clear GOS picture with mode 5 and coefficient of variation CV=12.5%, while group B cannot be assigned a representative GOS value, because of its large variability (CV=50%).
Relation between NSE levels (ng/ml) and GOS
As shown in Figure 4 there are three distinct NSE regions: group I consisting of 13 patients with NSE values Ł15ng/ml, group II consisting of 7 patients with 15ng/mlł19 ng/ml. Group I shows a clear preference for a GOS value of 5 (CV=9%), while group II shows a large variability (CV=41%). Group III is a special case, since these patients died after a short period. The Mann-Whitney non-parametric test applied to the GOS values of each group pair, I-II, II-III and I-III, showed that all groups differ significantly from each other. However, the small number of patients (only 3) in group III does not allow reliable conclusions to be drawn concerning this NSE region.
Fig. 4. The graph shows three distinct neuron-specific enolase (NSE) level regions: I with NSE Ł15 (u), II with 15ł19 (p).
Relation between SPECT and NSE levels
As expected SPECT/SPDS values are in a definite relationship to NSE levels (ng/ml) as shown in Figure 5. The classification and colouring scheme is the same as in Figure 2. SPECT/SPDS and NSE levels of groups II and I are positively linearly correlated with Spearman´s coeff=0.71, while group III clearly defines a separate population. The linear correlation between SPECT/SPDS and NSE is statistically significant at a level of p<0.05.
Fig. 5. Patients of group I (u) and II (n) have single photon emission computed tomography (SPECT) and neuro-specific enolase (NSE) levels (ng/ml) positively linearly correlated with Spearman´s coeff=0.71 (p<0.05). Patients of group III (p) diverge from this behaviour.
Sensitivity and Specificity
In order to evaluate the diagnostic specificity and sensitivity of the SPECT method, we calculated the receiver-operating curve (ROC), which has defined SPDS values of 7 or 8 as the best cut-off value for SPECT diagnostic accuracy. The status of the patients was classified as abnormal if their GCS at the time of SPECT/SPDS was<15. Using the obtained values we calculated a sensitivity of 100%, specificity of 82% and efficiency of 91% (91% of the patients are correctly classified), clearly better than those obtained with the usually applied cut-off value of 6 (sensitivity of 100%, specificity of 59% and efficiency of 80%).
Discussion
Cerebral vasospasm is a frequent complication after subarachnoid haemorrhage and contributes to overall morbidity and mortality. Pathogenesis is poorly understood. Blood products, lipid peroxidation by oxygen free radicals, norepinephrine and prostaglandins are some of the proposed mechanisms of vasospasm [14]. Indeed, thickness of the blood clot appears to be required so that delayed cerebral ischaemia (vasospasm) can occur [13-15]. Secondary ischaemia only rarely occurs in the settings of trauma, intraventricular and intraparenchymal arterial blood at high pressure in contact with the vessels at the base of the brain, in haemorrhage (e.g. from artery-vessel malformation) or in SAH with distribution limited to a small area on the cerebral convexity [16].
Prompt medical treatment of ischaemia secondary to vasospasm can prevent permanent ischaemia [17]. So, early detection of vasospasm due to subarachnoid haemorrhage is very important. Angiography has been the gold standard for imaging vasospasm demonstrating the vascular luminal diameter, but angiography is invasive, potentially hazardous and carries the risk of exacerbation of vasospasm [18, 19]. Transcranial Doppler ultrasonography permits the non-invasive measurement of blood flow velocities in the basal brain arteries, but does not provide information concerning cerebral tissue perfusion because of its ineffectiveness in detecting vasospasm in smaller arteries [20, 21]. SPECT is promising for the detection of vasospasm in smaller vessels. Brain perfusion SPECT has been used to demonstrate regional cerebral blood flow and cerebral ischaemia secondary to SAH. Perfusion studies have been investigated for their use in identifying patients who are at risk of developing vasospasm or permanent ischaemia after SAH. Naderi et al. found SPECT to be highly sensitive, 88%, but with reduced specificity, 68%. Powsner et al. reported 89% sensitivity and 71% specificity of SPECT for the detection of vasospasm [22, 23]. During the past decade, cerebral SPECT imaging has become a critical diagnostic imaging modality of many neurological disorders, but few studies have dealt with the correlation between SPECT findings after SAH and clinical outcome [24]. In our study, we found that patients with mild perfusion defects have had good clinical outcome (Figure 3, Group A). On the other hand, patients with moderate and severe perfusion defects appear to have a very variable score of the clinical outcome (Figure 3, Group B). We cannot assign a representative GOS value, because of its large variability (CV=50%). One possible explanation for this could be the location and the vulnerability of the destroyed brain area.
We measured NSE serum levels in 23 patients with SAH due to rupture of cerebral aneurysm. Serum NSE levels were significantly higher in patients with a poor outcome than in patients with a good outcome, who had low NSE serum levels throughout their courses (Figure 4). More specifically, three patients who died had NSE high levels (>29 ng/ml). Probably, NSE levels increase with the development of delayed ischaemic neurological deficits and this happens especially in poor outcome patients [25, 26]. High NSE levels, such as those observed in the patients who died, probably reflect greater neuronal damage and could have prognostic value.
Two patients with small lesions (SPECT studies) and low levels of NSE suffered a poor outcome because the lesion was located in a vulnerable area of the brain. On the other hand, 3 patients with large or moderate lesions and high concentrations of NSE had good clinical outcome. One possible explanation could be that the brain area where the lesion was found was non-eloquent.
NSE appearance in the serum is the result of its release following neuronal damage. In SAH patients, NSE seems to be a sensitive marker of brain damage, and its serum concentration reflects the severity of disease, a finding that may be of use in predicting clinical outcome. In some cases of SAH, patients´ increased NSE levels can be measured in serum 4 days after ictus; this may be attributed to vasospasm (secondary brain damage) [27]. Data from the literature show very different and often conflicting results. Kuroiwa et al. state that there was no correlation between serum NSE levels in patients with SAH and consciousness levels, clinical status or prognosis [28-30]. NSE was elevated in the serum after regional hypoperfusion as a complication of SAH, a finding related to vasospasm. According to our study there is a significant correlation between SPECT abnormal areas (SPDS) and NSE levels on admission (Spearman´s coeff=0.71, p<0.05). This correlation does not include the 3 cases which have very high NSE serum levels.
CONCLUSION – Clinical implications
The results of the present study suggest that the measurement of NSE serum levels is valuable as an indirect marker of brain dysfunction following SAH damage. Moreover, combining SPECT and NSE findings on admission could offer valuable prognostic data in SAH patients. Finally, the clinical implications of using both SPECT-ECD imaging and NSE serum level calculation need to be further evaluated in a large number of patients with SAH.
Acknowledgements
The authors thank the medical statistician Dr. Alexia Zaganides and the skilful technician Anastasia Ziaka for their assistance.
Piśmiennictwo
1. Catafau AM: Brain SPECT in Clinical Practice. Part I: Perfusion J Nucl Med 2001; 42: 259-271. 2.Messa C, Fazio F, Costa DC, et al.: Clinical brain radionuclide imaging. Sem Nucl Med 1995; 25:111-143. 3.Rider CC, Taylor CB: Enolase isoenzymes in rat tissues: Electrophoretic, chromatographic, immunological and kinetic properties. Biochim Biophys Acta 1974; 365: 285-300. 4.Fletcher L, Rider CC, Taylor CB: Enolase isoenzymes III. Chromatographic and immunological characteristics of rat brain enolase. Biochim Biophys Acta 1976; 452: 245-252. 5.Schmechel D, Marangos PJ, Brightman M: Neuron-specific enolase is a molecular marker for peripheral and central neuroendocrine cells. Nature 1978; 276:834-836. 6.Schmechel D, Marangos PJ, Zis AP et al.: Brain enolase as a specific marker of neuronal and glial cells. Science 1978; 199:313-315. 7.Oertel M, Schumacher U, Mc Arthur DL et al: S - 100B and NSE: markers of initial impact of subarachnoid haemorrhage and their relation to vasospasm and outcome. J Clin Neurosci 2006; 21 [unprinted]. 8.Herrman M, Curio N, Jost C et al.: Release of biochemical markers of damage to neuronal and glial brain tissues is associated with short and long term neuropsychological outcome after traumatic brain injury. J. Neurol Neurosurg Psychiatry 2001; 70: 95-100. 9.Sindic C, Chalon M, Cambiaso C et al.: Assessment of damage to the central nervous system by determination of S-100 protein in the cerebrospinal fluid. J Neurol Neurosurg Psychiatry 1982; 45:1130-1135. 10.Pasquier J., Michel B., Brenot-Rossi I. Et al.: Value of 99m Tc-ECD SPECT for the diagnosis of dementia with Lewy bodies. Eur J Nucl Med 2002; 29:1342-1348. 11.Vera P, Farman-Ara B, Stievenart L: Proportional anatomical stereotactic atlas for visual interpretation of brain SPECT perfusion images. Eur J Nucl Med 1996; 23:871-877. 12.Costa DC, Ell PJ: Data Analysis. In: Clinician´s Guide to Nuclear Medicine. Brain Blood Flow in Neurology and Psychiatry. (Ed: Costa DC, Ell PJ), Churchill Livingstone. (London, New York, Chapter 4, 39-52, 1991). 13.Honma Y, Clower B.R, Haining JL: Comparison of Intimal Platelet Accumulation in Cerebral Arteries in Two Experimental Models of Subarachnoid Haemorrhage. J Neurosurg 1985; 63:433-440. 14.Allen GS, Gross C J, French LA: Cerebral Arterial Spasm. Part 5: In Vitro Contractile Activity of Vasoactive Agents Including Human CSF on Human Basilar and Anterior Cerebral Artery. J Neurosurg 1976; 44: 596-600. 15.Sakaki T, AsanoT, Takakura K: Nature of the Vasoactive Substance in CSF from Patients with Subarachnoid Haemorrhage. J Neurosurg 1984; 60:1186-1191. 16.Greenberg M.S: SAH and aneurysm. In: Handbook of Neurosurgery, Fourth Edition, (Ed: Greenberg M.S.), Greenberg Graphics, Inc, (Florida, Chapter 28, 814-867, 1977).17. Kim JS, Moon DH, Kim GE, et al.: Acetazolamide stress brain perfusion SPECT predicts the need for carotid shunting during carotid endarterectomy. J Nucl Med 2000; 11: 1836-1841. 18.Heros RC, Zervas NT, Varsos V: Cerebral vasospasm after subarachnoid haemorrhage: An update. Ann Neurol 1983; 14: 599-608. 19.Mani RL, Eisenberg RL: Complication of catheter cerebral arteriography: Analysis of 5,000 procedures. II. Relation of complication rates to clinical and arteriographic diagnoses. AJR 1978; 131: 867-869. 20.Aslid R, Markwalder TM, Nornes H: Non-invasive transcranial Doppler ultrasound recording of flow velocity in basal cerebral arteries. J Neurosurgery 1998; 57: 769-769. 21.Kontos HA: Validity of cerebral arterial blood flow calculations from velocity measurements (editorial). Stroke 1989; 20:1-3. 22. Naderi S, Ozguven MA, Bayhan H. et al.: Evaluation of cerebral vasospasm in patients with subarachnoid haemorrhage using single photon emission computed tomography. Neurosurg Rev 1994; 17: 261-265. 23.Powsner RA, Ôuama LA, Jabre A: SPECT imaging in cerebral vasospasm following subarachnoid haemorrhage. J Nucl Med 1998; 765-769. 24.Camargo CC: Brain SPECT in neurology and psychiatry. J Nucl Med 2001; 4: 611-623. 25.Mabe H, Suzuki S, Mase M: Serum neuron-specific enolase levels after subarachnoid haemorrhage. Surg Neurol 1991; 36:170-174. 26.Cunningham RT, Morrow JI, Johnston CF. et al.: Serum neuron-specific enolase concentrations in patients with neurological disorders. Clin Chim Acta 1994; 230: 117-24.27. Rundstrom G., Hartvig Mendel, Escher T. et al.: S-100 Protein and Neuron-Specific Enolase in Cerebrospinal Fluid and Serum: Markers of Cell Damage in Human Central Nervous System. Stroke 1987; 18: 911-918. 28.Kuroiwa T, Tanabe H, Arai M. et al.: Measurement of serum neuron-specific enolase after subarachnoid haemorrhage and intracerebral haemorrhage. Clin Chim Acta 2002; 235: 145-56. 29.Pfeifer R., Borner A., Krack A. et al.: Outcome after cardiac arrest: predictive values and limitations of the neuroproteins neuron-specific enolase and protein S-100 and the Glasgow Coma Scale. Rescititution 2005; 65: 49-55. 30.Selakovits V., Raicevic R., Radenovic L: The increase of neuron-specific enolase in cerebrospinal fluid and plasma as a marker of neuronal damage in patients with acute brain infarction. J Clin Neurosci 2005; 12: 542-7.
