Emilia Czyzewska1, Agnieszka Kujawiak2, Dagna Bobilewicz1, Lukasz Szarpak3, 4, *Lukasz Czyzewski5
The assessment of the utility of novel peripheral blood morphology parameters, including reticulocytic, in the diagnosis of iron deficiency and sideropenic anemia
Ocena użyteczności nowych parametrów morfologii krwi obwodowej, w tym retikulocytarnych, w diagnostyce niedoboru żelaza i niedokrwistości syderopenicznej
1Department of Laboratory Diagnostics, Medical University of Warsaw, Poland
2Student of Laboratory Medicine, Medical University of Warsaw, Poland
3Department of Emergency Medicine, Medical University of Warsaw, Poland
4Department of Emergency Medicine and Disaster, Medical University of Bialystok, Poland
5Department of Nephrology Nursing, Medical University of Warsaw, Poland
Streszczenie
Wstęp. Niedokrwistość syderopeniczna (IDA) stanowi 80% wszystkich niedokrwistości. Pod względem diagnostycznym należy do grupy niedokrwistości mikrocytowych, niedobarwliwych. Do diagnostyki różnicowej IDA i niedokrwistości chorób przewlekłych (ACD), której towarzyszy funkcjonalny niedobór żelaza, wykorzystywane są zarówno rutynowe parametry morfologii krwi, jak i parametry biochemiczne.
Cel pracy. Celem pracy była ocena użyteczności nowych parametrów krwi obwodowej, w tym retikulocytarnych, w diagnostyce niedoboru żelaza i niedokrwistości syderopenicznej, z uwzględnieniem wpływu komponenty zapalnej.
Materiał i metody. Materiał stanowiło 275 wyników morfologii krwi obwodowej z retikulocytami uzyskanych z analizatora Sysmex XN 2000. Próbki pochodziły od pacjentów Samodzielnego Publicznego Centralnego Szpitala Klinicznego w Warszawie. Materiał badawczy podzielono na dwie grupy: grupa I – 275 próbek z oznaczonym stężeniem CRP, traktowanym jako kryterium rozpoznania stanu zapalnego, a wśród nich próbki z CRP < 5 mg/l i z CRP ≥ 5 mg/l, grupa II – 67 próbek z bezwzględnym niedoborem żelaza, bez wpływu komponenty zapalnej (saturacja transferyny < 16% i stężenie CRP < 5 mg/l). Wszystkie oznaczenia wykonano w materiale pochodzącym z jednoczasowego pobrania.
Wyniki. Największą wartość AUC w diagnostyce bezwzględnego niedoboru żelaza uzyskano odpowiednio dla: UIBC – 0,939, S-RET-He – 0,926, Fe – 0,915, S-%MicroR – 0,898 i S-%HYPO-He – 0,896, podczas gdy wartości pola pod krzywą dla „rutynowych” parametrów morfologii, na podstawie których diagnozuje i różnicuje się IDA, wynoszą: S-HGB – 0,721 i S-MCV – 0,872. Z wyliczonych wartości AUC wynika, że zarówno S-%MicroR, jak i S-%HYPO-He mają większą moc diagnostyczną niż np. powszechnie stosowany parametr do różnicowania niedokrwistości syderopenicznej, jakim jest MCV. Ponadto, wykazano ujemną, istotną statystycznie korelację pomiędzy stężeniem CRP i S-RET-He, S-%HYPO-He, S-Delta-He zarówno w grupie pacjentów ze stanem zapalnym, jak i bez stanu zapalnego.
Wnioski. W pracy wykazano, że nowe parametry morfologii krwi obwodowej, w tym retikulocytarne, są użyteczne w diagnostyce niedoboru żelaza. Nie umożliwiają jednak różnicowania niedoboru bezwzględnego i funkcjonalnego, gdyż wykazują zależność od stanu ostrej fazy.
Summary
Introduction. A sideropenic anemia (IDA) account for 80% of all cases of anemia and diagnostically it belongs to microcytic and non-pigmented anemia. In order to differentiate IDA and chronic disease anemia (ACD) which is accompanied by functional iron deficiency, both routine blood morphology and biochemical parameters are used.
Aim. The aim of the study was to the assessment of the utility of novel peripheral blood morphology parameters, including reticulocytic, in the diagnosis of iron deficiency and sideropenic anemia.
Material and methods. The material included 275 results of peripheral blood counts with reticulocytes obtained from the Sysmex XN 2000 analyzer from patients of the Independent Public Central Clinical Hospital in Warsaw. The material was divided into 2 groups: group I – 275 samples with a measured CRP concentration, established as a criterion for diagnosis of inflammation, which were further divided into samples with CRP < 5 mg/l CRP ≥ 5 mg/l, group II – 67 samples with absolute iron deficiency, without the influence of inflammatory component (transferrin saturation < 16% and CRP concentration < 5 mg/l). All of the measurements were made on the material from the simultaneous collection.
Results. The highest AUC value in the diagnosis of absolute iron deficiency was obtained for: UIBC – 0.939, S-RET-He – 0.926, Fe – 0.915, S-% MicroR – 0.898 and S% HYPO-He – 0.896 respectively, while the values of the area under the curve for the “routine” morphology parameters, which are the basis of IDA diagnosis and differentiation, are: S-HGB – 0.721 and S-MCV – 0.872. The calculated AUC values show that both S-% MicroR and S-% HYPO-He have more diagnostic power than e.g. MCV which is the parameter commonly used for the differentiation of sideropenic anemia. In addition, we found a statistically significant negative correlation between the concentration of CRP and S-RET-He, S-% HYPO-He, S-Delta-He, in both groups of patients.
Conclusions. The study showed that novel parameters of peripheral blood morphology, including reticulocytic ones, are useful in the diagnosis of iron deficiency. However, they are not able to differentiate between absolute and functional deficiencies, since they are influenced by the acute phase.

INTRODUCTION
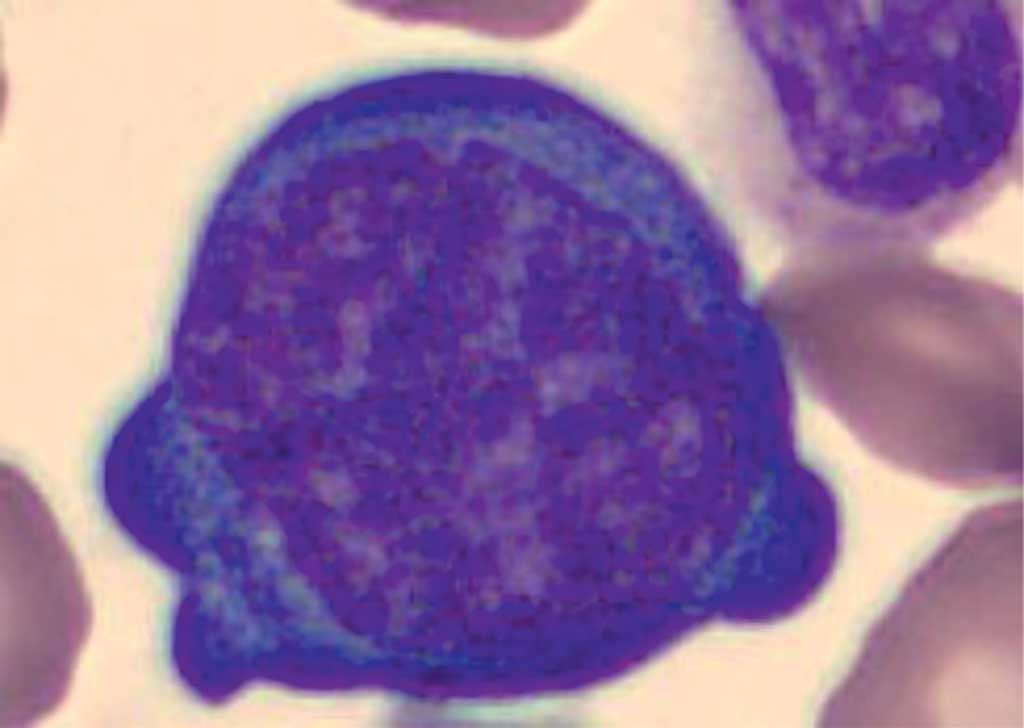
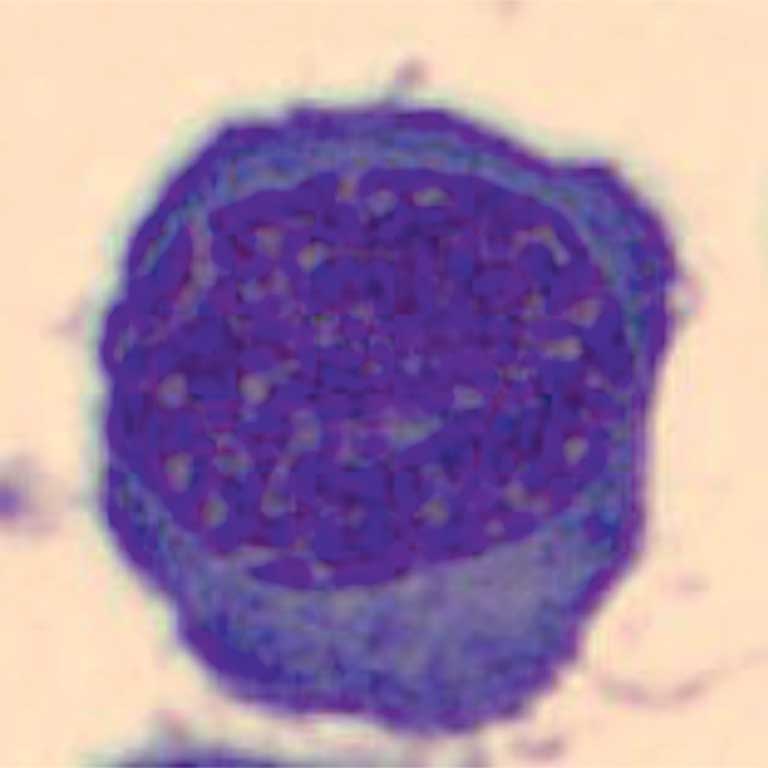
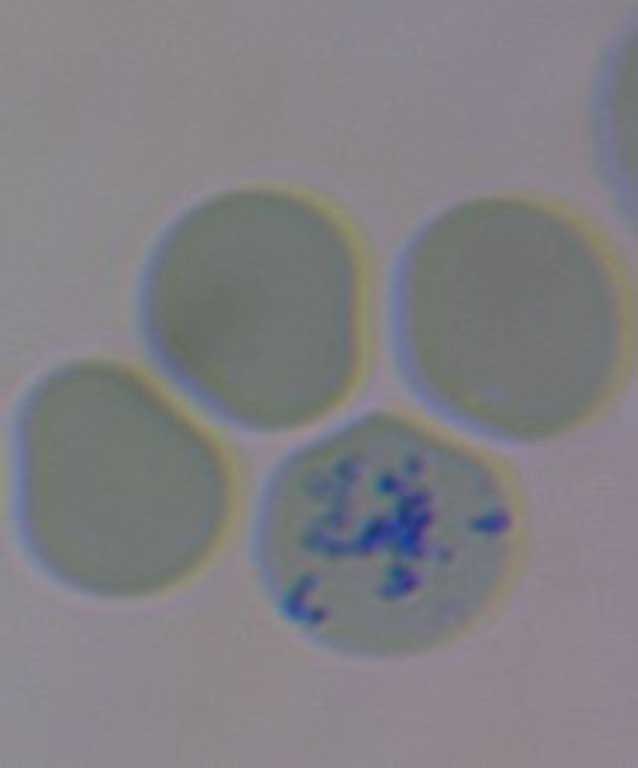
Reticulocytes are precursors of red blood cells produced during erythropoiesis in the bone marrow. A multistage process of differentiation takes place, originate with the stem cells which transforms into proerythroblast, then into basophilic erythroblast, followed by polychromatophilic erythroblast and acid-absorbing erythroblast (orthochromatic). When the last one extrudes the cell nucleus, it becomes a reticulocyte which further matures in the bone marrow for two days. After release into the peripheral blood, it becomes a mature erythrocyte within approximately 24 hours. The number of reticulocytes in whole blood reflects the erythropoietic efficiency of the bone marrow and the level of eytropoiesis intensity (1). Figures 1-5 present an image of erythropoiesis cells. The erythroblasts were stained with the May-Grunwald-Giemsa method and the reticulocytes were stained intravitally with methylene blue. The photos were obtained from Central Laboratory of Independent Public Central Clinical Hospital in Warsaw (SP CSK) archive. Currently the vast majority of medical laboratories have an analyzer equipped with an automatic reticulocyte determination module. However, before these methods became so widely available, reticulocytes were counted manually. In the whole blood sample stained intravitally with alkaline dyes (e.g. methylene blue, gentian violet, brilliant blue FCF), the number of reticulocytes was determined for at least 1000 erythrocytes. The result was given in percent or per mil in relation to the number of erythrocytes. When compared to manual methods the automatic are have a smaller error, with better repeatability and take less time since the counting is made in about 1 minute. Additionally automatisation of the counting process allowed for obtaining additional parameters that characterize the reticulocytes population (2). The so called reticulocyte parameters obtained by automated methods include: the number reticulocytes relative to the erythrocyte count (Ret%), the absolute reticulocyte count (Ret #), fraction of unmatured reticulocytes – which is the sum of HFR and MFR (IRF), reticulocyte fraction based on low (LFR), mean(MFR) and high fluorescence (HFR), mean reticulocyte volume (MRV) and the reticulocyte hemoglobin equivalent (RET-He).

Fig. 1. Proerythroblast

Fig. 2. Basophilic erythroblast
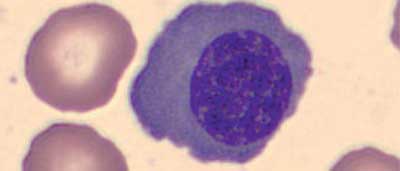
Fig. 3. Polychromatophilic erythroblast

Fig. 4. Eosinophilic erythroblast

Fig. 5. Reticulocyte
The factors which may interfere with automatic methods of measuring both the reticulocytes count and parameters include: Howell-Jolly bodies, intracellular parasites, basophilic stippling of erythrocytes and dyes used in angiography. The main indications for the determination of reticulocyte parameters are: differential diagnosis of anemia, monitoring of iron, vitamin B12, folic acid and erythropoietin therapies or monitoring of the patient’s condition after bone marrow or stem cell transplantation. The number of reticulocytes is presented in both relative and absolute values. The greater clinical significance is attributed to absolute values since they directly reflect the erythropoiesis activity. A particularly important parameter when monitoring the renewal of bone marrow function after transplantation is the IRF, since it reflects the changes in the red cell rejuvenation system most rapidly. The IRF increases just after a few hours from bone marrow or stem cell transplantation, while the total number of reticulocytes increases only after 2-3 days. LFR, MFR and HFR are distinct reticulocyte fractions divided by the degree of their maturity. They are used to monitor both erythropoietin treatment (in dialysis patients) and anemia therapy. Each manufacturer of blood analyzers establishes its own “gating” method for the reticulocytic (scategram) which is then used to divide reticulocytes into individual populations.
The reticulocyte hemoglobin equivalent (RET-He) reflects current iron resources available for erythropoiesis. Therefore when there is a gradual decrease in body stores of iron, RET-He shows changes much earlier than the classical parameters e.g. concentration of hemoglobin. It is used mostly to monitor chronically dialyzed patients and when treating IDA sideropenic anemia.
Parameters included into the “research” group are not yet considered and approved for routine measurements. The assessment of their usefulness requires further research which will confirm their role, both diagnostic and clinical. The following should be mentioned: hemoglobin delta (S-Delta-He), percentage of microcytes (S-% MicroR) and percentage of hypochromic erythrocytes (S-% HYPO-He). S-Delta-He is the difference between the hemoglobin concentration in reticulocyte (S-RET-He), and the hemoglobin concentration in mature red blood cells (S-RBC-He). Delta-He reflects the level of erythropoiesis intensity dependent on the systemic availability of iron. If the value of this parameter increases, the “efficiency” of erythropoiesis increases. When the parameter decreases in value or drops below zero (negative delta-He) it may mean that there is a gradual reduction of iron availability (both in absolute and functional deficiency e.g. in the course of inflammation and chronic diseases) and the verge of developing anemia. S-Delta-He is described not only as a marker of iron availability for erythropoiesis, but also a potential marker of inflammation (3). According to the manufacturers of blood analyzers, the S-% MicroR is intended to narrow the potential causes of anemia during differential diagnosis (2). S-% MicroR is the percentage of microcytes, or erythrocytes with a volume less than 80 fl (4). S-% HYPO-He is a calculated parameter and it is the percentage of hypochromic red blood cells, defined as the ones with a hemoglobin content below 17 pg (4). It reflects the systemic availability of iron for erythropoiesis and is a reliable marker of functional and absolute iron deficiency (5).
The biochemical parameters determined in the serum and used to assess the iron metabolism are: iron concentration (Fe), transferrin concentration (Transf), transferrin saturation (TfS), ferritin (Ferryt), total iron-binding capacity (TIBC) and unsaturated iron-binding capacity (UIBC) and soluble transferrin receptor (sTfR) (tab. 1).
Tab. 1. Reference ranges of biochemical parameters of iron metabolism applicable for Laboratorium Centralne SP CSK in Warsaw
| Parameter | Women | Men | Unit |
| Fe | 37-158 | μg/dl |
| Transf | 250-320 | mg/dl |
| TfS | 15-50 | % |
| Ferryt | 13-150 | 30-400 | ng/ml |
| TIBC | 149-504 | μg/dl |
| sTfR | 1.79-4.63 | mg/l |
Iron is a micronutrient crucial for erythropoiesis. The systemic reserves contain about 4 g of which about 2.5-3 g are stored in erythrocytes and their precursors. The recommended daily intake is estimated for 1-2 mg daily. Fe can be absorbed mainly in the duodenum in both heme (meat containing hemoglobin and myoglobin) and the ferrous ions form (hydroxides, citrates, iron oxalates). Fe in the heme form is absorbed independently of the gastric juice pH, whereas non-heme Fe requires a low pH to be fully absorbed.
Therefore, during Fe supplementation, it is recommended to eat foods rich in vitamin C and to reduce antacids. The malabsorption of Fe may be caused by the damaged stomach mucosa, ulcers or shortened intestinal transit. The iron is imported form the apical membrane by the divalent metal transporter DMT1 (in order for the non-heme iron to be absorbed, it must first be reduced by the ferrireductase, the enzyme which is present in the duodenum), then passes through the cell membrane to the basal membrane and from there to the plasma (Fe is exported from enterocytes and macrophages by ferroportin-1). In the plasma the Fe is bound with transferrin which is a transport protein. The highest amount of Fe is stored in macrophages of the liver and the regulation of its release is regulated by hepcidin. On the surface of hepatocytes the transferrin receptors are located, which allows for rapid Fe release when it’s needed urgently. The main Fe storage protein in the body is ferritin, however some part of Fe is stored in hemosiderin (Fe accumulated in hemosiderin is hardly available for erythropoiesis). Everyday with exfoliated intestinal, bladder and epidermis cells about 1-2 mg Fe is lost with additional amount being lost with menstrual bleeding. So far, the mechanism of active removal of Fe from the body has not been examined.
The vast the majority of the iron being built in the heme comes from “recycling”, meaning when the erythrocyte is destroyed the iron which was accumulated in it is phagocytized, to be later incorporated into the new red blood cell (6). The process is regulated by macrophages of the retinal endothelial system (RES) (1, 7). Iron measured in the blood serum is a subject to large circadian fluctuations. According to the guidelines, the sample should be collected from the patient in the morning on an empty stomach. The result of Fe measurements are significantly influenced by inflammation, which results in redistribution of iron in the body and lowering of iron concentration in serum (1). Contrary to that after eating a meat meal, while taking dietary supplements and in hemolyzed samples the results are elevated. Ferritin and transferrin are proteins produced in the liver. Ferritin is localized mainly intracellularly, in body fluids and in low concentrations in the blood. It is an iron storage protein, which is able to store up to 4500 iron atoms (usually 2000) and it is a positive protein of acute phase. The decrease in its concentration indicates the systemic iron deficiency. Values < 12 μg/l with 50% sensitivity and 90% specificity indicate an absolute Fe deficiency. However elevated concentration does not necessarily mean iron overloading, since it is a positive acute phase protein and during inflammation the concentrations increases (8). The concentration of ferritin also increases in hyperthyroidism, in the elderly patients, in liver diseases, alcoholism and during taking oral contraception. The false decrease of ferritin level is characteristic for vitamin C supplementation, hypothyroidism and after physical exercise. The increase in serum ferritin may be caused by the damage of the liver, spleen and bone marrow cells. Transferrin is an iron transporting protein; it can bind up to two atoms of iron. It attaches to the surface of the cell where the transferrin receptor is localized and in the process of endocytosis goes inside the cell. The serum transferrin concentration does not show circadian fluctuations (9). Iron deficiency stimulates transferrin synthesis in order to bind as much Fe as possible from the limited resources. Transferrin is a negative acute phase protein, which means that during inflammation, independently of systemic Fe resources, its concentration decreases. Increased transferrin concentration occurs in pregnancy and during taking the oral contraceptives. Therefore a more useful parameter than the transferrin concentration itself is the transferrin saturation with iron (so-called transferrin saturation). TfS is the ratio of Fe concentration and serum transferrin concentration. TfS values lower than 16% indicate an absolute or functional deficiency of Fe, therefore it is possible that this might be the effect of an inflammatory component, e.g. during ACD. TfS < 10% strongly indicates IDA. Values > 45% are characteristic for iron overload conditions (congenital and secondary hemochromatosis) (1).
TIBC is the total iron binding capacity, which reflects the total amount of Fe that can be bound to transferrin. The reduced TIBC value indirectly provides information about the transferrin concentration. The lower there is the concentration of Fe in the serum, the higher the TIBC value is. The unsaturated iron binding capacity (UIBC) is the difference between TIBC and iron concentration; it reflects the amount of iron needed to completely saturate transferrin. Both ferritin and transferrin are acute phase proteins. During the differential diagnosis of functional and absolute deficiency of Fe, the concentration of C-reactive protein (CRP) should be additionally measured. Its concentration increases during bacterial infections, inflammation, trauma, cancer or heart attack and in other conditions (8). The transferrin receptor (TfR) is a transmembrane glycoprotein which has a high affinity for iron-saturated transferrin. TfR receptors take part in the process of iron endocytosis into cells. TfR serum concentration depends on the need of aforementioned cells for Fe and erythropoietic activity of cells in the bone marrow, both of which importantly are independent of the acute phase. Immunochemical methods made it possible to measure the proteolytically cleaved fragment of the external receptor; the so-called soluble part of TfR soluble transferrin receptor – sTfR, which is an indicator of tissue iron deficiency. sTfR is elevated in iron deficiency (in the latent stage) and during increased erythropoiesis (e.g. acute hemorrhagic anemia). In the acute phase as a reliable iron deficiency parameter the quotient of the ratio of sTfR and the logarithm of transferrin concentration is used. Values > 1.5 indicate a shortage of iron, especially the values > 2 (1).
The golden standard for assessing iron resources is staining bone marrow with Prussian blue revealing the presence of iron and sideroblasts. However, as it is an invasive method it’s rarely used now in the differential diagnosis of sideropenic anemia (1).
The World Health Organization (WHO) defines anemia as a reduction in hemoglobin(HGB) concentration below:
– 11 g/dl in children from 6 months to 6 years old,
– 12 g/dl in children from 6 to 14 years old,
– 13.5 g/dl in adult men,
– 11.5 g/dl in adult women,
Powyżej zamieściliśmy fragment artykułu, do którego możesz uzyskać pełny dostęp.
Mam kod dostępu
- Aby uzyskać płatny dostęp do pełnej treści powyższego artykułu albo wszystkich artykułów (w zależności od wybranej opcji), należy wprowadzić kod.
- Wprowadzając kod, akceptują Państwo treść Regulaminu oraz potwierdzają zapoznanie się z nim.
- Aby kupić kod proszę skorzystać z jednej z poniższych opcji.
Opcja #1
29 zł
Wybieram
- dostęp do tego artykułu
- dostęp na 7 dni
uzyskany kod musi być wprowadzony na stronie artykułu, do którego został wykupiony
Opcja #2
69 zł
Wybieram
- dostęp do tego i pozostałych ponad 7000 artykułów
- dostęp na 30 dni
- najpopularniejsza opcja
Opcja #3
129 zł
Wybieram
- dostęp do tego i pozostałych ponad 7000 artykułów
- dostęp na 90 dni
- oszczędzasz 78 zł
Piśmiennictwo
1. Dmoszyńska A: Wielka interna – hematologia. Medical Tribune Polska, Warszawa 2011.
2. Sysmex training materials – Reticulocytes and their meaning red blood cell markers; http://www.sysmex.pl/materialy-naukowe/centrum-wiedzy/parametry-badawcze.html (data dostępu: 28.06.2016).
3. Danielson K, Beshara S, Quershi AR: Delta-He: a novel marker of inflammation predicting mortality and ESA response in peritoneal dialysis patients. Clin Kidney J 2014; 7: 275-281.
4. Urrechaga E, Borque L, Escanero JF: Erythrocyte and reticulocyte parameters in iron deficiency and thalassemia. J Cl Lab An 2011; 25: 223-228.
5. Urrechaga E, Borque L, Escanero JF: Erythrocyte and reticulocyte indices in the assessment of erythropoiesis activity and iron availability. Int J Lab Hematol 2013; 35: 144-149.
6. Ogilvie C, Fitzsimons E: Serum Ferritin and Iron Studies – Laboratory Reporting and Clinical Application in Primary Care, Primary Care at a Glance – Hot Topics and New Insights, InTech 2012; http://www.intechopen.com/books/primarycare-at-a-glance-hot-topics-and-new-insights/serum-ferritin-and-iron-studies-laboratory-reporting-and-clinicalapplication-in-primary-care.
7. Fleming R: Tracing a trace element – an overview of iron metabolism; www.sysmex.pl.
8. Dembińska-Kieć A, Naskalski W: Diagnostyka laboratoryjna z elementami biochemii klinicznej. Elsevier Urban & Partner, Wrocław 2013.
9. Orlicz-Szczęsna G, Żelazowska-Posiej J, Kucharska K: Iron deficiency anemia. Curr Probl Psychiatry 2011; 12: 590-594.
10. Ostrowski G, Kościelska M: Diagnosis and treatment of iron deficiency in chronic kidney disease. Nefrol Dial Pol 2012; 16: 178-180.
11. Torino AB, Gilberti Mde F, da Costa E et al.: Evaluation of erythrocyte and reticulocyte parameters as indicative of iron deficiency in patients with anemia of chronic disease. Rev Bras Hematil Hemoter 2015; 37: 77-81.
12. Dmoszyńska A, Robak T: Podstawy hematologii. Czelej, Lublin 2008.
13. Butarello M, Pajola R, Novello E: Diagnosis of iron deficiency in patients undergoing hemodialysis. Am J Clin Pathol 2010; 133: 949-954.
14. Mayo Clinic: Complete blood count (CBC.) Why it’s done – Tests and Procedures 2014; mayoclinic.org.
15. Bomski H: Podstawowe laboratoryjne badania hematologiczne. Państwowy Zakład Wydawnictw Lekarskich, Warszawa 1995.
16. Chełstowska M, Warzocha K: Clinical symptoms and laboratory changes in differential diagnosis of anaemia. Onkol Prakt Klin 2006; 2: 106-116.
17. Bovy C, Gothot A, Delanaye P: Mature erythrocyte parameters as new markers of functional iron deficiency in haemodialysis: sensitivity and specificity. Nephrol Dial Transplant 2007; 22: 1156-1162.
18. Urrechaga E, Borque L, Escanero JF: Potential utility of the new Sysmex XE 5000 red blood cell extended parameters in the study of disorders of iron metabolism. Clin Chem Lab Med 2009; 47(11): 1411-1416.
19. Rehu M, Ahonen S, Punnonen K: The diagnostic accuracy of the percentage of hypochromic red blood cells (%Hypom) and cellular hemoglobin in reticulocytes (CHr) in differentiating iron deficiency anemia and anemia of chronic diseases. Clin Chim Acta 2011; 412: 1809-1813.
20. Muusze RG, Verslujs CM, Ulenkate JLM: Successful implementation of an anaemia algorithm using Ret-He at ZorgSaam Hospital Zeeuws-Vlaanderen, the Netherlands. Sysmex Journal International 2008; 18: 44-49.
21. Joosten E, Lioen P, Brusselmans C et al.: Is analysis of the reticulocyte haemoglobin equivalent a useful test for the diagnosis of iron deficiency anaemia in geriatric patients? Eur J Intern Med 2013; 24(1): 63-66.
22. Urrechaga E, Borque L, Escanero JF: Analysis of reticulocyte parameters on the Sysmex XE 5000 and LH 750 analyzers in the diagnosis of inefficient erythropoiesis. Int Jnl Lab Hem 2011; 33: 37-44.
23. Spmmelrock MJ, Raggam RB, Amrein K: Reticulocyte hemoglobin content allows early and reliable detection of functional iron deficiency in blood donors. Clin Chim Acta 2012; 413: 678-682.
24. Torino AB, Gilberti Mde F, da Costa E et al.: Evaluation of erythrocyte and reticulocyte parameters as indicative of iron deficiency in patients with anemia of chronic disease. Rev Bras Hematol Hemoter 2015; 37(2): 77-81.
25. Peerschke EIB, Pessin MS, Maslak P: Using the hemoglobin content of reticulocytes (RET-He) to evaluate anemia in patient with cancer. Am J CLin Pathol 2014; 142: 506-512.