© Borgis - New Medicine 1/2014, s. 29-32
*Mihály Dió1, Tibor Deutsch1, Judit Mèszáros2
An educational model of glucose homeostasis in diabetes mellitus
1Department of Medical Imaging and Technology, Faculty of Health Sciences, Semmelweis University, Budapest, Hungary
Head of Department: Éva Kis, PhD
2Faculty of Health Sciences, Semmelweis University, Budapest, Hungary
Head of the Faculty: prof. Zoltán Zsolt Nagy, PhD
Summary
A simulation model of glucose homeostasis in diabetes mellitus could be very useful for patient, student and health-carer training. In this paper, the first design phase of the modelling work is presented. The new comprehensive educational model of glucose homeostasis described in this report attempts to provide an anatomically explicit basis for simulations that incorporates up-to-date quantitative knowledge about glucose metabolism and its control by insulin. The overall glucose homeostasis model consists of differential mass balance equations complemented by differential or algebraic relationships for each metabolic source or sink term. Major clinical parameters such as basal glucose and insulin levels along with hepatic glucose production are used for customizing the model for individual patients. The educational model allows the simulation of 24-hour blood glucose (BG) profiles for non-diabetic subjects as well as for people with insulin-dependent (type 1) diabetes mellitus (IDDM) and non-insulin dependent (type 2) diabetes mellitus (NIDDM). Graphs of the model functions are provided, and example simulations are shown demonstrating the inner workings of the model.
INTRODUCTION
Diabetes mellitus is a syndrome of impaired carbohydrate, fat, and protein metabolism caused by either a lack of insulin secretion or decreased sensitivity of the tissue to insulin. For people with insulin-dependent (type 1) diabetes mellitus (IDDM), insulin must be provided from an exogenous source other than the pancreas. People with NIDDM may also end up requiring insulin.
Insulin requiring patients should adjust their insulin dose(s) according to their blood sugars and in relation to various lifestyle events. This represents a daily challenge, as many factors influence glycaemia, such as diet, meal composition, and exercise, as well as stress. Often diabetic patients have developed their skills by some trial-and-error-like training over a long period of time. The task is non-trivial, and many patients would benefit from some sort of educational support. Learning how to modulate insulin therapy in relation to food intake and insulin injections to prevent out-of-target BG deviations would be very useful. However, education of people with diabetes requires a level of clinical expertise which although present in specialised diabetes units, and some general practices with an interest in diabetes, is not always to be found in other sectors of the health service.
The working hypothesis underlying the interactive educational diabetes simulation approach has been that enabling people to try out different therapeutic and dietary alternatives can help them to gain experience in achieving glycaemic control, without the risks of actually experiencing hypoglycaemic or hyperglycaemic episodes. With the simulator, users can specify nearly unlimited numbers of ‘virtual diabetic patients’ and test how different types of treatment, doses and dosing regimens, and even lifestyle (dietary) changes affect the daily BG profile. If a simulated regimen is found unable to keep glycaemia within desired limits, users can try alternative management regimens that seem to improve this daily pattern.
The circulating concentrations of glucose are normally maintained in health within a narrow range by homeostatic control mechanisms involving endocrine hormones, principally insulin and glucagon. Glucose metabolism involves a wide spectrum of transport and metabolic processes some of which are difficult to measure in vivo. Mathematical models, therefore, have the potential to play an important role in the identification and quantification of mechanisms.
Clinically relevant models describing the important metabolite and hormone dynamics in diabetic patients have been developed since the 1960s; for recent reviews see Makroglou (1) and Stahl et al. Model formulations vary in form and detail as primarily determined by their intended use. While the glucoregulatory system involves multiple metabolites and hormones, most existing models focus only on the dynamics of glucose and insulin (2-6). Various approaches have been used including ordinary differential equations, delayed differential equations, partial differential equations, and integro-differential equations (1).
Physiologically based models, with the body compartmentalized into physiological compartments representing the organs and tissues important in terms of glucose homeostasis. (7-9). The Sorensen (7) physiological model comprised a system of 22 mass balance equations, which predict glucose, insulin, and glucagon concentrations in each compartment. Puckett (8) developed a model very similar to Sorensen’s, but did not include glucagon’s effects, and removed all transport terms besides the metabolic sources and sinks. Farmer et al. developed a model framework to describe the biochemical species associated with glucose metabolism (9). Recently the Sorensen model was adapted for NIDDM patients (10). Different models have also been proposed to describe the dynamics of glucose absorption after meals and the absorption of insulin following sc injections of different insulin preparations. Mari et al. (11) proposed another model to describe insulin secretion involving the time delay between the glucose signal and insulin secretion.
Subcutaneous insulin absorption is a complex process which is affected by many factors including tissue blood flow, injection site/depth, injected volume and concentration (12). Insulin absorption from subcutaneous injection or infusion has been widely studied since Binder et al. (12). For a review see Nucci & Cobelli (13). Berger & Rodbard (14) prediction of plasma insulin levels for various insulin preparations. More on physiology and pharmacokinetics, has been described by Mosekilde and colleagues (15). This approach was later modified by Trajanowski et al. (16). The model was also extended to support monomeric insulin analogues (17-18).
The accumulated new knowledge and recent models have allowed the development of a comprehensive educational model of glucose homeostasis which is able to represent conditions typical for both IDDM and NIDDM patients. This article overviews the new model and provides a description of some of the model’s output.
METHODS
Our goal has been to produce an educationally useful model of glucose homeostasis for teaching, self-learning, and demonstration purposes. The model of Sorensen (7) were taken as a starting point for the current work, but reasonable simplifications of the original model have been made. The new model presented here comprises two major sub-models describing glucose and insulin kinetics. These two sub-models are linked by control functions described as algebraic expressions. Figure 1 shows the flow diagram displaying the elements that appear to be essential for a dynamic educational model. The arrows show the blood flow direction and the rectangular blocks represent different compartments. Continuous lines denote fluxes of material and dashed lines denote control signals.
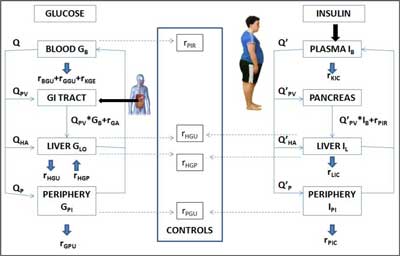
Fig. 1. The scheme of the model.
The left hand side of the figure shows the diagram of glucose kinetics which contains the tissues where a large portion of metabolism operates using most of the glucose for energy. These sites include blood, liver, and peripheral compartments. The blood compartment is created by pooling heart, lung, brain, gut and kidney tissues but excludes liver and peripheral tissues. Muscles and adipose tissue are represented as the periphery. Because of a significant gradient from capillaries to the intracellular space, two sub-compartments are considered in the periphery. The stomach and intestine are lumped into the gut compartment which serves as the location where exogenous glucose enters the body.
The diagram for insulin (right hand side, Figure 1) includes the plasma, liver, and periphery. The plasma compartment comprises the heart, lungs, kidneys and gut tissues where the hormone is removed. Endogenous secretion delivers insulin directly to liver. Like in the glucose model, the periphery is divided into plasma and interstitial pools the latter being responsible for peripheral insulin action. Insulin is degraded at its primary action sites, the muscle and liver cells, and is also cleared by the kidneys. The pancreas is included as the site in which endogenous secretion takes place in people with NIDDM.
While glucose stimulates pancreatic insulin secretion, insulin controls glucose production and utilisation in various organs and tissues. Muscle, along with the liver, is a site at which glucose uptake must be insulin-mediated. Glucose regulates its own uptake through a mass action effect and through a regulatory mechanism that acts on the pathway enzymes. These interactions constitute the operating feedback loop that controls BG levels (middle panel of figure 1).
For glucose, these processes are glucose absorption following food ingestion, hepatic production and hepatic uptake, peripheral glucose uptake, kidney excretion and insulin-independent uptake in the brain and red blood cells. For insulin, rates are described for subcutaneous insulin absorption, pancreatic insulin release and for insulin clearance by the liver, kidneys, and in the periphery. Linkage between glucose and insulin sub-models is established by making hepatic glucose production and uptake of glucose by the liver and peripheral compartments dependent on insulin concentration, and insulin release dependent on glucose concentration and its change. Using the diagram shown in Figure 1, it is possible to write mass balance equations for the two species in the various body pools. These mass balance equations for each compartment and species (glucose and insulin) along with the specification of the relevant forcing functions constitute the mathematical model of glucose homeostasis which can be used to predict how glucose/insulin concentrations evolve over time. a generic subcutaneous model of insulin analogue absorption has been incorporated into insulin analogue absorption model of Tarin et al. (17) Pancreatic insulin release appears as a source term in the liver insulin compartment. Simplified version of the Mari model has been incorporated.
The overall model consists of 14 non-linear differential equations, 38 algebraic equations, and 58 parameters. The mass balance equations for the glucose and insulin model are given subscripts distinguish physiological compartments.
Readers are referred to Tarín et al. (17) for the details of the mathematical description of the model, and to Lehmann et al. (18-19) for information about the work that has been done to incorporate this model into the AIDA v4 diabetes simulator.
The model described in this report contains a large number of parameters. Model parameters were selected to have clear anatomical and/or physiological meaning. Patient populations 23-24 individual patients can be generated by setting model parameters to reflect the organ affected and the extent of derangement. These derangements separately or combined can be modelled systematically as the source and sink terms in the different organs. Using parameters such as hepatic glucose effectiveness (glucose control on endogenous glucose production suppression) and hepatic insulin sensitivity (insulin control on endogenous glucose production suppression) enables a more detailed specification to be made of diabetic patients with special impairments.
The model is integrated using a fourth-order Runge-Kutta method with a step size of 0.25 minute. The model is computed using the Berkeley Madonna simulation tool (www.berkeleymadonna.com). The underlying model of glucose-insulin interaction will be desribed elsewhere.
RESULTS
The model is implemented with a view to providing rapid real-time simulation of BG profiles over a 24-hour period for individuals with IDDM and NIDDM with different types and degrees of derangements in their metabolism.
In the figure 2 the upper graph shows the simulated BG levels while the lower graphs serves to display the timing and doses of insulin injections and meals. Superimposed on this graph is the predicted plasma insulin profile as calculated by the software.
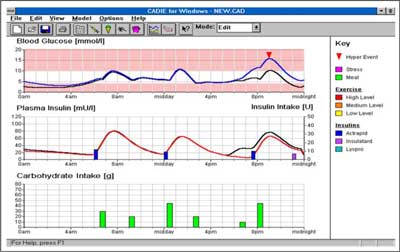
Fig. 2. Simulation of a 70 kg male, IDDM patient on a three times daily insulin injection regimen.
It shows a simulation after a change in the „virtual patient’s” regimen, with the addition of 5 units of a short-acting (Actrapid) insulin injection at 6:00am. The resultant lowering of the BG profile is clear to see.
Figure 2 shows a 70 kg male, IDDM patient on a three times daily insulin injection regimen. It shows the rate of appearance of glucose in plasma following meals of the same size with different compositions simulated with the proposed model. It also demonstrates the use of the model as an educational tool where the glycaemic effect of missing a morning injection is simulated for this patient. The hyperglycaemia which would result is predicted to reach a maximum of 16.8 mmol/l at 21:00 hrs.
A case study is presented to illustrate the potential of the model, e.g. comparing a non-diabetic subject versus an insulin-resistant subject.
CONCLUSIONs
This model, once coded in an easy to use simulator, intends to create an educational/learning experience for different users. However not all the functions catered for by the model will necessarily be of use to all users. Nevertheless it is hoped that a user-friendly simulation program incorporating this model would be a great help to empower patients in their own diabetes self-management. The educational model described allows users to simulate from a glycaemic perspective the 24-hour daily life of people with diabetes. It is proposed that an intuitive graphical user interface will allow users – even without specific expertise in modelling – to interact with this glucose homeostasis model in an educational setting. Clearly it will also be important to extend the model to cover exercise and stress Compartmentalisation, parameterisation and modelling approaches were all chosen to allow for such extensions and revisions to be made more easily in later stages of the model’s development.
Piśmiennictwo
1. Makroglou A, Li J, Kuang Y: Mathematical models and software tools for the glucose-insulin regulatory system and diabetes: an overview. Applied Numerical Mathematics 2006; 56: 559-573. 2. Biermann E: DIACATOR: simulation of metabolic abnormalities of type II diabetes mellitus by use of a personal computer. Computer Methods & Programs in Biomedicine 1994; 41: 217-229. 3. Cobelli C, Nucci G, Del Prato S: A physiological simulation model of the glucose–insulin system in type I diabetes. Diabetes Nutrition & Metabolism 1998; 11: 78-80. 4. Guyton JR, Foster RO, Soeldner JS et al.: A model of glucose-insulin homeostasis in man that incorporates the heterogeneous fast pool theory of pancreatic insulin release. Diabetes 1978; 27: 1027-1042. 5. Mari A: Mathematical modeling in glucose metabolism and insulin secretion. Current Opinion Clinical Nutrition Metabolism Care 2002; 5: 495-501. 6. Rutscher A, Salzsieder E, Fischer U: KADIS: model aided education in type I diabetes. Computers Methods & Programs in Biomedicine 1994; 41: 205-215. 7. Sorensen JT: A physiologic model of glucose metabolism in man and its use to design and assess improved insulin therapies for diabetes. PhD Thesis. Department of Chemical Engineering, Massachusetts Institute of Technology, Cambridge, MA, USA 1985. 8. Puckett WR: Dynamic modelling of diabetes mellitus, PhD Dissertation, Department of Chemical Engineering, The University of Wisconsin-Madision, USA 1992. 9. Farmer TG: Intravenous closed-loop glucose control in type I diabetic patients. PhD Thesis, University of Texas at Austin, TX, USA 2007. 10. Vahidi O, Kwok KE, Gopaluni RB, Sun L: Development of a physiological model for patients with type 2 diabetes mellitus. Bioch Engin J 2011; 55: 7-16. 11. Mari A, Camastra S, Toschi E et al.: A model for glucose control of insulin secretion during 24 hours of free living. Diabetes 2001; 50 (Suppl. 1): S164-S168. 12. Binder C, Lauritzen T, Faber O, Pramming S: Insulin pharmacokinetics. Diabetes Care 1984; 7: 188-199. 13. Nucci G, Cobelli C: Models of subcutaneous insulin kinetics. A critical review. Computer Methods & Programs in Biomedicine 2000; 62: 249-257. 14. Berger M, Rodbard D: Computer simulation of plasma insulin and glucose dynamics after subcutaneous insulin injection. Diabetes Care 1989; 12: 725-736. 15. Mosekilde E, Jensen KS, Binder C et al.: Modeling absorption kinetics of subcutaneous injected soluble insulin. Journal of Pharmacokinetics & Biopharmaceuticals 1989; 17: 67-87. 16. Trajanowski Z, Wach P, Kotanko P wt al.: Pharmacokinetic model for the absorption of subcutaneously injected soluble insulin and monomeric insulin analogues. Biomedizinische Technik (Berl) 1993; 38: 224-231. 17. Tarín C, Teufel E, Picó J et al.: Comprehensive pharmacokinetic model of insulin Glargine and other insulin formulations. IEEE Transactions on Biomedical Engineering 2005; 52: 1994-2005. 18. Lehmann ED, Deutsch T, Broad D: AIDA: an educational simulator for insulin dosage and dietary adjustment in diabetes. London: British Diabetic Association 1997. 19. Lehmann ED, Tarín C, Bondia J wt al.: Incorporating a generic model of subcutaneous insulin absorption into the AIDA v4 diabetes simulator. Journal of Diabetes Science & Technology 2007; 1: 423-435 – 2007; 1: 780-793 – and – 2009; 3: 190-201.