*Mónika Rózsa1, István Jankovics1, Ildikó Visontai1, István Barcs2
Detection of neuraminidase-inhibiting antibodies for measurement of Influenza vaccine immunogenicity
1National Centre for Epidemiology, Budapest, Hungary
Head of Centre: Márta Melles, MD
2Department for Epidemiology, Institute of Health Promotion and Clinical Methodology, Faculty of Health Sciences, Semmelweis University, Budapest, Hungary
Head of Department: prof. István Barcs, MD, PhD
Summary
Introduction. The HA and NA proteins are in the lipid envelope of virions. The HA and NA are an integral membrane proteins and its neuraminidase activity is required for efficient release of viral particles from the infected cell. Neuraminidase activity might be measured by neuraminidase inhibition assay.
Aim. The present study is aimed at testing the usability of a new method which allow for the detection and quantification of neuraminidase inhibiting antibodies.
Material and methods. The results of the four methodologies were compared with each other: Takátsy-assay, ELISA-microneutralization assay, CPE-microneutralization assay and new neuraminidase inhibition (NI) assay lectin peanut agglutinin conjugated peroxidase (PNA) technique. Haemagglutinin inhibition is a traditional method was used as the “gold standard” in our investigations.
Human sera have been used in our studies which obtained from vaccinated people. Inactivated seasonal influenza vaccines have been in development for over 50 years in Hungary. Inactivated vaccines contain a trivalent mixture of inactivated strains of the influenza viruses likely to circulate during the next influenza season. Inactivated whole-virus influenza vaccine is administered intramuscularly. After vaccination the humoral antibody levels are detected against to influenza virus surface antigens: haemagglutinin (HA), neuraminidase (NA) virus-specific neutralizing antibodies to influenza viruses.
Results. After seasonal vaccination induced neuraminidase inhibiting (NI) serum antibody titers detected by PNA and the Takátsy-assay are correlated. PNA assay is a very sensitive assay, resulting in significantly higher NI titers as compared to the Takátsy-assay. NI serum titers detected by PNA and haemagglutinin inhibiting titers are highly correlated.
Conclusions. This new NI method is useful to better standardize influenza vaccines’ immunological requirements prior to their commercialisation and it can be usefully assay in microbiological labs, as it is very easy to standardize.
Introduction
There are two external glycoprotein components coded by virus genome on the surface of influenza virus particles. The HA protein is responsible for attachment and infection of the host cell and is the most immunogenic protein of the virus (1). The present study is aimed at testing the usability of a new method which allow for the detection and quantification of NA antibodies. Neuraminidase is an enzyme on the surface of influenza viruses that cleaves terminal sialic acid from sugar residues and from glycoproteins and so releases virus from the infected cells. Neuraminidase activity might be mesured by NI assay. This assay is based upon enzymatic removal by NA of the sialic acid residual of the fetuin. When a neuramindase substrate is coated on to the wells of a microplate and peroxidase conjugated peanut agglutinin recognizes and binds the free galactose, it is possible to quantitate the binding of PNA. The amount of bound PNA correlated directly with te amount of sialic acid removed from the substrate and therefore with the neuraminidase activity (2, 3). Neuraminidase inhibition (NI) test is used for the titration of antibodies against neuraminidase antigen in human sera. By reacting with specific epitopes that are located near to the enzyme active site, anti-neuraminidase antibodies are capable of inhibiting the virus induced desialylation of the substrate. Such antibodies therefore reduce the binding of peroxidase conjugated peanut agglutinin.
Aim
The present study is aimed at testing the usability of a new method which allow for the detection and quantification of NA antibodies.
Material and methods
Virus preparations (4): The following virus strain were grown in 10 day-old embrionated chicken eggs:
– A/New Caledonia/20/99 (H1N1)-like strain (A/New Caledonia/20/99 [IVR-116]),
– A/Wisconsin/67/2005 (H3N2)-like strain (A/Wisconsin /67/2005 [NYMC X-161]),
– B/Malaysia/2506/2004-like strain (B/Malaysia/2506 /2004).
Preparation of hyper immune sera: Chickens were immunized intravenously and boosted 3 weeks later. Whole blood was obtained by cardiac puncture approximately 4 weeks after the boost and sera stored at -20°C. The chicken antisera were specific for the inoculating strain as demonstrated by HA and NA inhibition assay.
Haemagglutination inhibition test (HI) (5): HA was quantified based on a method described by Hirst (1942) (6) and then later modified by Salk (1944) (7). This traditional method for identifying subtype of influenza isolates, and is usually more rapid than serological diagnosis.
The microneutralization assay (VN) (5): This test is a highly sensitive and specific assay for detecting virus-specific neutralizing antibodies to influenza viruses. The VN test was evaluated by ELISA or CPE (Cytopathogenic Effect) assay.
Neuraminidase inhibition assays (NI): NI test is used for the titration of antibodies against neuraminidase antigen in human sera. Neuraminidase is an enzyme on the surface of influenza viruses that cleaves terminal sialic acid from sugar residues and from glycoproteins and so releases virus from the infected cells.
Takátsy-assay (8): The NA activity and NI (9) micro-method assay based on Warren’s colour reaction (9) that modified later by Takátsy and Barb (1978). Standard TBA Assay: Neuraminidase-inhibition by antibody is measured according to the thiobarbituric acid (TBA) assay for the free sialic acid released from fetuin in solution. A colour development is measured.
Peroxidase-conjugated Lectin Peanut Agglutinin assay (PNA): Using fetuin as a substrate neuraminidase activity can be mesured (10). After the coating of fetuin on 96-well plates sera and standardised amount of viruses are mixed and added to the wells. After incubation and wash PNA is added, it binds to free galactose and is detected using an enzyme-linked immunosorbent assay. The amount of PNA that is bound is proportional to the amount of neuraminidase that is present. Changes in the NI titers of sera collected before and after vaccination with influenza virus can be observed. In 1995, a private Hungarian company, Omninvest Ltd. received a national marketing authorization for flu vaccine produced by the use of the same method, containing inactivated whole virus and AlPO4 as an adjuvant.
In this report, we used following procedure. The 96--weel microplates coated with fetuin (50 μg/ml in 0.1 M Carbonate-Bicarbonate Buffered Solution), 150 μl/well overnight at +4°C or 1 hour + 37°C. Wash with 350 μl/well PBS Buffer containing 0.5% TWEEN 20. The viruses must be standardized to have a 4 x OD value of the blank. Dilute viruses’ 2-scale and add 100 μl to each well overnight at +37°C and wash. Add 100 μl PNA (2 μg/ml in PBS) to each well and incubate 1 hour in room temperature. After washing add 100 μl OPD + UREA (substrate) to each well and the reaction then stopped by adding 100 μl/well 1N H2SO4. Read results on 492-620 nm by ELISA-Reader. Neuraminidase inhibition test: the sera ere diluted a 2-scale in PBS. A mixture of 50 μl of standardized viral suspension and 50 μl of diluted serum, overnight at +37°C and wash. Result of the PNA and OPD + UREA reaction measured were made ELISA reader as well as the virus standardization assay.
Results
The results of the four methodologies were compared with each other and with the HAI assay. HAI assay was used as the “gold standard” in our investigations. ELISA virus neutralization test and PNA NI test was the most sensitive methods and these tests are more objective results. There is a comparative study between NI Takátsy spectrophotometric methodology and the PNA system.
The test results correlate with each other (tab. 1).
Table 1. Comparison NI titers of the sera pairs with PNA test and Takátsy-NI methods.
| Virus strain | NAI titers PNA-POD (ELISA) |
1
1/2 | 2
1/2 | 3
1/2 | 4
1/2 | 5
1/2 | 6
1/2 | 7
1/2 | 8
1/2 | 9
1/2 |
| N1 | */1280 | 40/640 | 40/160 | 40/640 | 40/320 | 40/1280 | 40/640 | 80/1280 | < 40/< 40 |
| N2 | < 40/80 | 1280/1280 | 160/640 | < 40/160 | 160/640 | 640/2560 | 640/640 | 40/640 | 160/160 |
| B | 160/640 | 320/640 | 160/320 | 80/640 | 320/640 | 160/1280 | 40/1280 | 80/1280 | 80/160 |
| Virus strain | NAI titers Spectrophotometric detection (Takátsy) |
1
1/2 | 2
1/2 | 3
1/2 | 4
1/2 | 5
1/2 | 6
1/2 | 7
1/2 | 8
1/2 | 9
1/2 |
| N1 | */* | 2/16 | 2/8 | 2/4 | 2/8 | 2/16 | 2/8 | 2/8 | 2/4 |
| N2 | 1/1 | 8/16 | 8/8 | 1/1 | 1/8 | 4/16 | 4/8 | 1/8 | 4/4 |
| B | 0/0 | 8/64 | 16/32 | 4/32 | 16/32 | 16/128 | 1/128 | 8/64 | 8/16 |
N1 – A/New Caledonia/20/99 (H1N1)-like strain (A/New Caledonia/20/99 [IVR-116]); N2 – A/Wisconsin/67/2005 (H3N2)-
-like strain (A/Wisconsin/67/2005 [NYMC X-161]); B – B/Malaysia/2506/2004-like strain (B/Malaysia/2506/2004); 1-9 – number of samples; 1/2 – serum pairs (pre-vaccination serum/collected serum 2 weeks after vaccination); *few serum
Thus 8 sera-pairs were role of PNA method in the N1 specific test. 7 sera pairs showed seroconversion. Top of results proved in No. 2, 4, 6, 7 and 8. The No. 9 sera-pair was not shown titer increase.
6 sera pairs showed seroconversion in the N2 specific test. Top of results proved in No. 3, 4, 5, 6, 8. No. 9 sera-pair was not shown titer increase.
5 sera pairs showed seroconversion in the B specific test. Top of results proved in No. 6, 7, and 8. No. 9 sera-pair was not shown 4-times titer increase as it is N1, N2 specific NI test.
No. 4, 6, 7 and No. 8 sample pairs had NI responses induced after seasonal influenza vaccination for all three (N1, N2, B) against influenza subtypes.
In the N1, N2 and B specific tests of PNA-POD (ELISA) there were 9 sera-pairs.
In the N1 specific test there was a few of sera in No. 1 sera-pair for assay. Thus 8 sera-pairs were role of this method. 7 sera pairs showed seroconversion. In the results of pre-vaccination sera (No. 2-No. 9) were observed about 40 dilution values. In contrast the results of post-vaccination sera were observed between 40-1280 dilution values. Top of results proved in No. 2 (40/640), No. 4 (40/640), No. 6 (40/1280), No. 7 (40/640), and No. 8 (80/1280). No. 9 sera-pair was not shown titer increase.
In the N2 specific test were 6 sera pairs showed seroconversion. In the results of pre-vaccination sera (No. 1-No. 9) were observed between 80-1280 dilution values. In contrast the results of post-vaccination sera were observed between 80-2560 dilution values. Top of results proved in No. 3 (160/640), No. 4 (< 40/160), No. 5 (160/640), No. 6 (640/2560), No. 8 (40/640). No. 9 sera-pair was not shown titer increase.
In the B specific test were 5 sera pairs showed seroconversion. In the results of pre-vaccination sera (No.1-No. 9) were observed 40-320 dilution values. In contrast the results of post-vaccination sera were observed between 160-1280 dilution values. Top of results proved in No. 6 (160/1280), No. 7 (40/1280), and No. 8 (80/1280). No. 9 sera-pair was not shown 4-times titer increase (80/160) as it is N1, N2 specific test.
No. 4, No. 6, No. 7, and No. 8 sample pairs had NI responses induced after seasonal influenza vaccination for all three (N1, N2, B) against influenza subtypes.
In the N2 and B specific tests of Takátsy-spectrophotometric detection methodology there were 9 sera-pairs.
In the N1 specific test there was a few of sera in No. 1 sera-pair for assay. Thus 8 sera-pairs were role of this method. 6 sera pairs showed seroconversion (fig. 1). In the results of pre-vaccination sera (No. 2-No. 9) were observed 2 dilution values. In contrast the results of post-vaccination sera were observed between 4-16 dilution values. Top of results proved in No. 2 (2/16) and No. 6 (2/16).
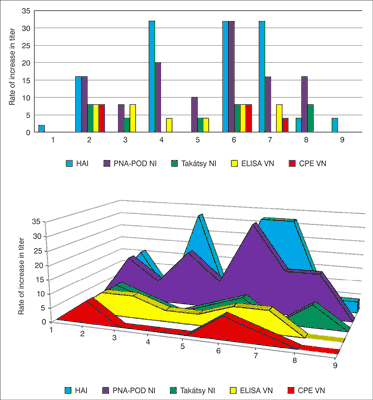
Fig. 1. Comparison of the results of the four test methods showed seroconversion (four-time titer increase between first and second sera) observed in results of the No. 2 and No. 6 sample pairs in all laboratory assay. No. 9 sera-pair was not shown 4-times titer increase. The correlation coefficient value of ~ 0.8 indicates that there is significant association between the HI and PNA method.
No. 4 and 9 sera-pairs were not shown 4-times titer increase (2/4) (fig. 2).
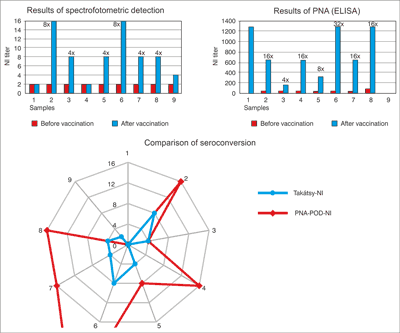
Fig. 2. Comparison N1 specific NI titers of the sera pairs obtained with PNA test and Takátsy-methods. There is a significant difference between the PNA and Takátsy test. The NI titers are different significantly from pre-and post-vaccination sera. There are 4-times or high than 4-times rate of increase in titers with the exception of No. 9 sample-pair. The correlation coefficient value of 0.5 indicates which is a weak relationship between the two test results. Low correlation coefficient can be explained by the PNA-POD assay found a higher titer differences.
In the N2 specific test were 3 sera pairs showed seroconversion. In the results of pre-vaccination sera (No. 1-No. 9) were observed between 1-8 dilution values. In contrast the results of post-vaccination sera were observed between 1-16 dilution values (fig. 3). Top of results proved in No. 5 (1/8), No. 6 (4/16), No. 8 (1/8). No. 1, 2, 3, 4, 7 and 9 sera-pairs were not shown titer increase (1/1, 8/16, 8/8, 1/1, 4/8, 4/4).
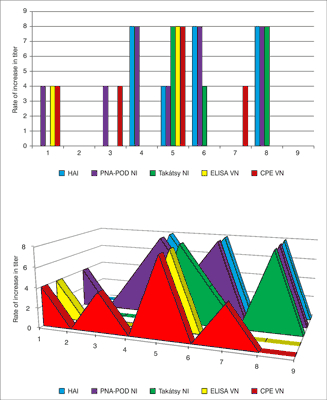
Fig. 3. Comparison N2 specific N2 titers of the sera pairs obtained with the different test methods. VN test and PNA-POD test can be read with ELISA reader which allows objectively assessment. The Takátsy N2 and CPE-VN test methods are highly subjective because these cannot be read by ELISA reader.
In the B specific test there was a few of sera in No. 9 sera-pair for assay. 5 sera pairs showed seroconversion. In the results of pre-vaccination sera (No. 1-No. 8) were observed between 1-16 dilution values. In contrast the results of post-vaccination sera were observed between 16-128 dilution values. Top of results proved in No. 1 (8/64), No. 3 (4/32), No. 5 (16/128), No. 6 (1/128), No. 7 (8/64). No. 2, 4 sera-pairs were not shown 4-times titer increase.
No. 5, No. 6, No. 8 sample pairs had NI responses induced after seasonal influenza vaccination for all three (N1, N2, B) against subtypes.
N1 specific tests
Comparison N1 specific NI titers of the sera pairs obtained with the different test methods. VN test and PNA-POD test can be read with ELISA reader which allows objectively assessment. The Takátsy NI and CPE-VN test methods are highly subjective because these cannot be read by ELISA reader. The correlation coefficient value of 0.774132 indicates that there is significant association between the HAI (gold standard method) and PNA-POD method (fig. 1, fig. 2).
N2 specific tests
Comparison of the results of the four test methods showed seroconversion (four-time titer increase between first and second sera) observed in results of the No. 5 sample pairs in all laboratory assay. No. 9 sera-pair also was not shown 4-times titer increase such as the N1 specific NI assay. We found no high titer differences between the first and second sera in contrast N1-specific NI tests were shown extremely high titer differences. The correlation coefficient value of 0.7 indicates that there is significant association between the HI (gold standard method) and PNA method. The correlation coefficient value was similar (0.8) in the N1-specific NI assays.
There is a significant difference between the PNA and Takátsy test. The NI titers are different from pre- and post-vaccination sera. There are 4-times or high than 4-times rate of increase in titers of No. 5, 6, 8 sample-pairs in both of test. There was no increase in titer for No. 2, 7, 9 sample-pairs in none of test. The correlation coefficient approaches to 1: value of 0.96 indicates that there is a significant correlation between the two methods (fig. 4).
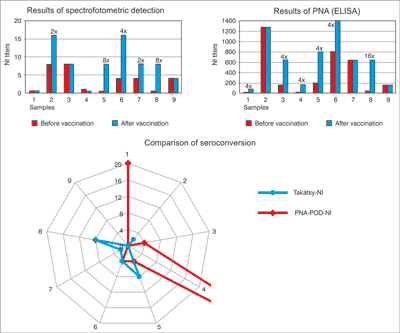
Fig. 4. Comparison N2-specific NI titers of the sera pairs obtained with PNA test and Takátsy-NI methods.
B specific test
Comparison of the results of the four test methods showed seroconversion (four-time titer increase between first and second sera) observed in results of the No. 4 and 8 sample pairs in all laboratory assay. No. 5 and 9 sera-pairs was not shown 4-times titer increase. Titer differences were not found in any tests, under investigation of the No. 9 sample pair. We found high titer differences between the first and second sera as well as N1-specific NI tests were also shown extremely high titer differences (fig. 5). The correlation coefficient value of 0.67 indicates that there is significant association between the HI (gold standard method) and PNA method. The correlation coefficient values were 0.8 in the N1-specific NI assay and 0.7 in the N2-specific NI assay.
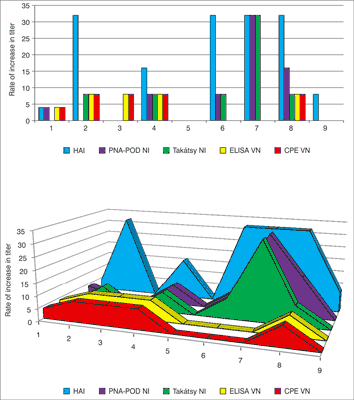
Fig. 5. Comparison B specific NI titers of the sera pairs obtained with the different test methods. VN test and PNA test can be read with ELISA reader which allows objectively assessment. The Takátsy NI and CPE-VN test methods are highly subjective because these cannot be read by ELISA reader.
There is a significant difference between the PNA and Takátsy-NI test. The NI titers are different from pre-and post-vaccination sera. There are 4-times or high than 4-times rate of increase in titers of No. 4, 6, 7, 8 sample-pairs in both of test. There was no increase in NI titer for No. 3, 5, 9, sample-pairs in none of test. The correlation coefficient approaches to 1: value of 0.91 indicates that there is a significant correlation between the two methods (fig. 6).
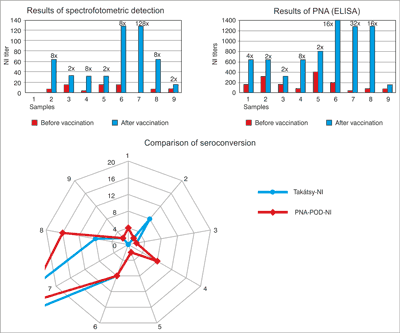
Fig. 6. Comparison B-specific NI titres of the sera pairs obtained with PNA test and Takátsy-methods.
Discussion
HI antibody responses are significantly induced after vaccination (fig. 7). It was around 75% seroconversion by HI assay against strain N1 of the trivalent seasonal influenza vaccine and 87.5% seroconversion by PNA assay, 66% by Takátsy assay. Around 45% seroconversion was observed against N2 influenza vaccine strains that is part of the seasonal trivalent influenza vaccine and 66% seroconversion by PNA assay, 33% by Takátsy assay. The humoral immune response was around 89% against B influenza vaccine strain by HI assay and 56% seroconversion by PNA assay, 56% by Takátsy assay.
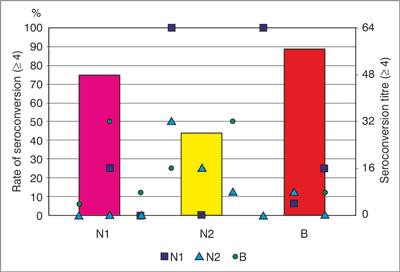
Fig. 7. Seasonal vaccination induced HI responses and HI seroconversion.
The NI antibody responses are significantly induced after vaccination.
Highest prevalence rates of NI seroconversion are induced N1 specific NI responses and the lowest proportion of of seroconversion are induced B specific NI responses.
There is 4 x differences between the first and second serum titers for both of methodology. The PNA system is much more sensitive and there is an implementation method is simpler and cheaper. Tenth part of sample volume is required for the PNA test compared to Takátsy method. The standardization of viruses is enough amniotic and allantoic fluid, unlike Takátsy’s system in which is required for the concentrated virus strains and it is more expensive and time-consuming method.
Conclusions
After seasonal vaccination induced NI serum titers detected by PNA and the Takátsy-assay are correlated. PNA assay is a very sensitive assay, resulting in significantly higher NI titers as compared to the TBA assay. NI serum titers detected by PNA and HI titers are highly correlated. PNA technique can be useful assay in microbiological labs, as it is very easy to standardize.
Acknowledgement
National Centre for Epidemiology; Department of Respiratory viruses’ staff.
Piśmiennictwo
1. Lamb RA, Krug RM.: Orthomyxoviridae: the viruses and their replication. In: Knipe DM, Howley PM, Griffin DE et al., editors. Fields Virology, 4th ed. Lippincott Williams & Wilkins. 2001: 1487–1531. 2. Montomoli E et all.: A method for detection of neuraminidase antibody in serum. International Congress Series. 2004: 1263 . 3. Lambrè CR, Terzidis H, Greffard A, and Webster RG.: Measurement of anti-influenza neuraminidase antibody using a peroxidase-linked lectin and microtiter plates coated with natural substrates. Journal of Immunological Methods. 1990: 135: 49-57. 4. Gyula T.: A purified precipitated virus obtained by a new, simple method. Acta Microbiol. Hung. 1953 5. WHO Global Influenza Surveillance Network: Manual for the laboratory diagnosis and virological surveillance of influenza. 2011. 6. HYPERLINK "http://www.ncbi.nlm.nih.gov/pubmed/?term=Hirst%20GK%5Bauth%5D" Hirst GK.: Adsorption of influenza hemagglutinins and virus by red blood cells. HYPERLINK "http://www.ncbi.nlm.nih.gov/pmc/journals/483/"J. Exp. Med. 1942:HYPERLINK "http://www.ncbi.nlm.nih.gov/pmc/issues/156529/" 76(2). 7. Salk, J.: A simplified procedure for titrating hemagglutinating capacity of influenza virus and the corresponding antibody. J. Immunol. 1944. 87-98. 49(2). 8. Gyula T, Barb K.: Adaptation of the influenza neuraminidase and neuraminidase-inhibition assays to the microtitrator system. Acta microbial. Acad Sci. hung. 1979: 63-69. 26. 9. Warren, L.: The thiobarbituric assay of sialic acids. J. Biol. Chem. 1959. 1971-1975. 234. 10. Aymard-Henry M, Coleman MT, Dowdle WR, Laver WG, Schild GC, Webster RG.: Influenzavirus neuraminidase and neuraminidase-inhibition test procedures. Bull World Health Organ. 1973. 199–202. 48(2).


