Diagnostyka obrazowa w zaburzeniach metabolicznych. Od metod tradycyjnych do nowoczesnych
Diagnostic imaging in metabolic disorders. From traditional to modern methods
Department of Endocrinology, Medical Center of Postgraduate Education, Bielański Hospital, Warszawa
Head of Department: prof. Wojciech Zgliczynski, MD, PhD
For ages, physicians have been strived to observe structures and functions of the human body. The great discoveries: of X-rays (in 1895) or ultrasounds (first technological application in 1917) have made possible to use these phenomena in medicine. At present, modern diagnostic departments use ultrasonography (US), radiology, computed tomography (CT), positron emission tomography (PET), single-photon emission computed tomography (SPECT), magnetic resonance imaging (MRI), and other techniques for the diagnosis and control of therapy of a range of diseases. In numerous biomedical research centers efforts are made in attempt to look inside the living cells and to observe life at its molecular level. So called molecular imaging is the non-invasive technique to visualize cellular processes at a molecular or genetic level. It includes the imaging of endogenous molecules, use of activable agents that sense specific cellular processes, use of labeled particles to follow particular metabolic pathways and exploit of genetic engineering to express specific protein products.
Naturally, these techniques lend themselves to all medical fields. However, given that metabolic disorders has emerged as a growing public health problem worldwide that reached epidemic proportion use of diagnostic imaging in patients with suspected or establish metabolic problems seems to be of crucial significance. Metabolism is the complex set of chemical reactions that organism uses to maintain life, including energy production and utilization. Food, made up of proteins, carbohydrates, and fats is a fuel, that is used right away, or is transferred into energy stored in body tissues. This energy is afterwards utilize for everyday activity. A metabolic disorder occurs when abnormal chemical reactions disrupt this process.
Starting point to look into metabolic disorders may be the metabolic syndrome (MS), for the first time described by Reaven in 1993 (1). Now function different definitions of this syndrome, but according to all of them MS integrates a group of abnormalities that enhance the risk of cardiovascular diseases. Central obesity, hyperinsulinemia, dyslipidemia and hypertension are regarded as an elements of the metabolic syndrome (2).
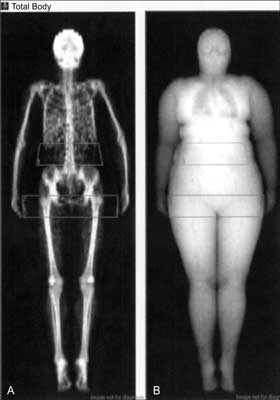
Fig. 1. Example of the regions of interest (ROI) delimiting abdominal (A) and gynoid (B) fat in one of woman examined in author’s clinic.
The phenomenon related directly to general obesity is ectopic lipid accumulation, i.e. in organs other than white adipose tissue, such as liver, muscles or heart. At present, magnetic resonance (MRI) is thought to be the most suitable method to visualize lipids content in peripheral tissues. In this technique, aided with 1-diamentinal magnetic resonance spectroscopy (MRS) measurement of total body fat mass with subsequent three-dimensional reconstruction and quantification of various fat depots is performed. Still present limitations of this method result from difficulties in precise determining the extend of saturated and unsaturated lipids within a tissue compartment, what is very important for cardiovascular risk prediction. To overcome these limitations use of spatially resolved MRS techniques were recently proposed (4-6). MRS is an analytical technique complement the MRI in the characterization of tissues. MRI uses the information to create 2-dimensional images of the structure, while MRS uses proton signals to determine the relative concentrations of target metabolites (7).
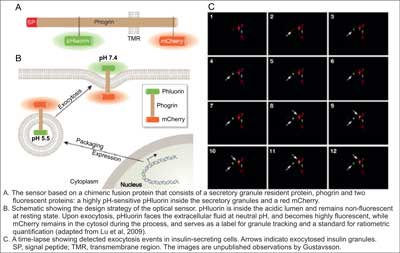
Fig. 2. An optical sensor for visualizing insulin granulate exocytosis (10).
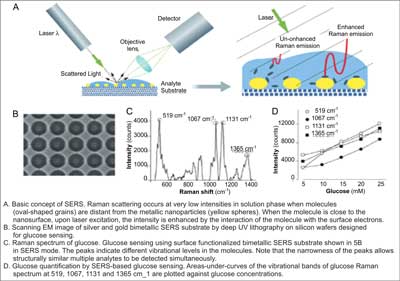
Fig. 3. Basic concept and applications of surface-enhanced Raman spectroscopy (10).
1. Reaven GM: Role of insulin resistance in human disease (syndrome X): an expanded definition. Annu Rev Med 1993; 44: 121-131.
2. Björntrop P: Metabolic implications of body fat distribution. Diab Care 1991; 14: 1132-1143.
3. Rissanen P, Hamalainen P, Vanninen E et al.: Relationship of metabolic variables to abdominal adiposity measured by different anthropometric measurements and dual-energy X-ray absorptiometry in obese middle-aged women. Int J Obes Relat Metab Disord 1997; 21: 367-371.
4. Springer F, Machann J, Claussen CD et al.: Liver fat content determined by magnetic resonance imaging and spectroscopy. World J Gastroenterol 2010; 16: 1560-1566.
5. Hammer S, Snel M, Lamb HJ et al.: Prolonged caloric restriction in obese patients with type 2 diabetes mellitus decreases myocardial triglyceride content and improves myocardial function. J Am Coll Cardiol 2008; 52: 1006-1012.
6. Vessby B, Gustafsson IB, Tengblad S et al.: Desaturation and elongation of fatty acids and insulin action. Ann N Y Acad Sci 2002; 967: 183-195.
7. Velan SS, Said N, Durst C et al.: Distinct patterns of fat metabolism in skeletal muscle of normal-weight, overweight, and obese humans. Am J Physiol Regul Integr Comp Physiol 2008; 295: R1060-1065.
8. Lu J, Gustavsson N, Li Q et al.: Generation of transgenic mice for in vivo detection of insulin-containing granule exocytosis and quantification of insulin secretion. J Innov Opt Health Sci 2009; 2: 397-405.
9. Faulds K, Barbagallo RP, Keer JT et al.: SERS as a more sensitive technique for the detection of labeled oligonucleotides compared to fluorescence. Analyst 2004; 129: 567-568.
10. Han W, Chuang K-H, Chang Y-T et al.: Imaging metabolic syndrome. EMBO Mol Med 2010; 2: 196-200.
11. Stuart DA, Yuen JM, Shah N et al.: In vivo glucose measurement by surface-enhanced Raman spectroscopy. Anal Chem 2006; 78: 7211-7215.
12. Shi C, Zhang Y, Gu C et al.: Molecular fiber sensor based on surface enhanced Raman scattering (SERS). J Nanosci Nanotechnol 2009; 9: 2234-2246.
13. Zheng Q, Dai H, Merritt ME et al.: A new class of macrocyclic lanthanide complexes for cell labeling and magnetic resonance imaging applications. J Am Chem Soc 2005; 127: 16178-16188.
14. Cohen B, Ziv K, Plaks V et al.: MRI detection of transcriptional regulation of gene expression in transgenic mice. Nat Med 2007; 13: 498-503.
15. Coenegrachts K, Van Steenbergen W, De Keyzer F et al.: Dynamic contrast-enhanced MRI of the pancreas: initial results in healthy volunteers and patients with chronic pancreatitis. J Magn Reson Imaging 2004; 20: 990-997.
16. Zhang S, Trokowski R, Sherry AD: A paramagnetic CEST agent for imaging glucose by MRI. J Am Chem Soc 2003; 125: 13511-13516.
17. Antkowiak PF, Tersey SA, Carter JD et al.: Nonivassive assessment of pancreatic beta-cell function in vivo with manganese-enhanced magnetic resonance imaging. J Am Physiol Endocrinol Metab 2009; 296: E573-578.
18. Zabow G, Dodd S, Moreland J, Koretsky A: Micro-engineered local field control for high sensitivity multispectral MRI. Nature 2008; 453: 1058-1063.
19. Takeuchi M, Lodato JA, Furlong KT et al.: Feasibility of measuring coronary flow velocity and reserve in the left anterior descending coronary artery by transthoracic Doppler echocardiography in a relatively obese American population. Echocardiography 2005; 22: 225-232.
20. Pavlopoulos H, Nihoyannopoulos P: Strain and strain rate deformation parameters: from tissue Doppler to 2D speckle tracking. Int J Cardiovasc Imaging 2008; 24: 479-491.
21. Heimdal A, Stoylen A, Torp H, Skjaerpe T: Real-time strain rate imaging of the left ventricle by ultrasound. J Am Soc Echocardiogr 1998; 11: 1013-1039.
22. Wong C, O’Moore-Sullivan T, Leano R et al.: Alterations of left ventricular myocardial characteristics associated with obesity. Circulation 2004; 110: 3081-3087.
23. Lorch S, Sharkey A: Myocardial velocity, strain, and strain rate abnormalities in healthy obese children. J Cardiometab Syndr 2007; 2: 30-34.
24. Ingul CB, Tjonna AE, Stolen TO et al.: Impaired cardiac function among obese adolescents: effect of aerobic interval training. Arch Pediatr Adolesc Med 2010; 164: 852-859.
25. Benjamin E, D’Agostino R, Belanger A et al.: Left atrial size and the risk of stroke and death. The Framingham Heart Study. Circulation 1995; 92: 835-841.
26. Hirschler V, Acebo H, Fernandez G et al.: Influence of obesity and insulin resistance on left atrial size in children. Pediatr Diabetes 2006; 7: 39-44.
27. Chen AP, Albers MJ, Cunningham CH et al.: Hyperpolarized C-13 spectroscopic imaging of the TRAMP mouse at 3T-initial experience. Magn Reson Med 2007; 58: 1099-1106.
28. Bots ML, Hoes AW, Koudstaal PJ et al.: Common carotid intima-media thickness and risk of stroke and myocardial infarction: the Rotterdam Study. Circulation 1997; 96: 1432-1437.
29. Tortoli P, Bambi G, Guidi F, Muchada R: Toward a better quantitative measurement of aortic flow. Ultrasound Med Biol 2002; 28: 249-257.
30. Urbani MP, Picano E, Parenti G et al.: In vivo radiofrequency-based ultrasonic tissue characterization of the atherosclerotic plaque. Stroke 1993; 24: 1507-1512.
31. Kawasaki M, Takatsu H, Noda T et al.: Noninvasive quantitative tissue characterization and two-dimensional color-coded map of human atherosclerotic lesions using ultrasound integrated backscatter: comparison between histology and integrated backscatter images. J Am Coll Cardiol 2001; 38: 486-492.
32. Lindner JR: Molecular imaging of cardiovascular disease with contrast-enhanced ultrasonography. Nat Rev Cardiol 2009; 6: 475-481.
33. Feinstein SB: The powerful microbubble: from bench to bedside, from intravascular indicator to therapeutic delivery system, and beyond. Am J Physiol Heart Circ Physiol 2004; 287: H450-457.
34. Owen DR, Shalhoub J, Miller S et al.: Inflammation within carotid atherosclerotic plaque: assessment with late-phase contrastenhanced US. Radiology 2010; 255: 638-644.
35. Hayes CE, Mathis CM, Yuan C: Surface coil phased arrays for high-resolution imaging of the carotid arteries. J Magn Reson Imaging 1996; 6: 109-112.
36. Yuan C, Mitsumori LM, Ferguson MS et al.: In vivo accuracy of multispectral magnetic resonance imaging for identifying lipid-rich necrotic cores and intraplaque hemorrhage in advanced human carotid plaques. Circulation 2001; 104: 2051-2056.
37. Moody AR, Murphy RE, Morgan PS et al.: Characterization of complicated carotid plaque with magnetic resonance direct thrombus imaging in patients with cerebral ischemia. Circulation 2003; 107: 3047-3052.
38. Wang J, Ferguson MS, Balu N et al.: Improved carotid intraplaque hemorrhage imaging using a slab-selective phase-sensitive inversion-recovery (SPI) sequence. Magn Reson Med 2010; 64: 1332-1340.
39. Detrano R, Guerci AD, Carr JJ et al.: Coronary calcium as a predictor of coronary events in four racial or ethnic groups. N Engl J Med 2008; 358: 1336-1345.
40. Motoyama S, Sarai M, Harigaya H et al.: Computed tomographic angiography characteristics of atherosclerotic plaques subsequently resulting in acute coronary syndrome. J Am Coll Cardiol 2009; 54: 49-57.
41. Komatsu S, Hirayama A, Omori Y et al.: Detection of coronary plaque by computed tomography with a novel plaque analysis system, “Plaque Map”, and comparison with intravascular ultrasound and angioscopy. Circ J 2005; 69: 72-77.
42. Rudd JH, Warburton EA, Fryer TD et al.: Imaging atherosclerotic plaque inflammation with (18F)-fluorodeoxyglucose positron emission tomography. Circulation 2002; 105: 2708-2711.
43. Tahara N, Kai H, Yamagishi S et al.: Vascular inflammation evaluated by (18F)-fluorodeoxyglucose positron emission tomography is associated with the metabolic syndrome. J Am Coll Cardiol 2007; 49: 1533-1539.
44. Choudhary S, Higgins CL, Chen IY et al.: Quantitation and localization of matrix metalloproteinases and their inhibitors in human carotid endarterectomy tissues. Arterioscler Thromb Vasc Biol 2006; 26: 2351-2358.
45. Rudd JH, Warburton EA, Fryer TD et al.: Imaging atherosclerotic plaque inflammation with (18F)-fluorodeoxyglucose positron emission tomography. Circulation 2002; 105: 2708-2711.
46. Rudd JH, Warburton EA, Fryer TD et al.: Imaging atherosclerotic plaque inflammation with (18F)-fluorodeoxyglucose positron emission tomography. Circulation 2002; 105: 2708-2711.
47. Cypess AM, Lehman S, Williams G et al.: Identification and importance of brown adipose tissue in adult humans. N Engl J Med 2009; 360: 1509-1517.
48. Targher G, Byrne CD: Nonalcoholic Fatty Liver Disease: A Novel Cardiometabolic Risk Factor for Type 2 Diabetes and Its Complications. J Clin Endocrinol Metab 2013; 98: 483-495.
49. Ortiz-Lopez C, Lomonaco R, Orsak B et al.: Prevalence of prediabetes and diabetes and metabolic profile of patients with nonalcoholic fatty liver disease (NAFLD). Diabetes Care 2012; 35: 873-878.
50. Chalasani N, American Gastroenterological Association, American Association for the Study of Liver Diseases et al.: The diagnosis and management of non-alcoholic fatty liver disease: practice guideline by the American Gastroenterological Association, American Association for the Study of Liver Diseases, and American College of Gastroenterology. Gastroenterology 2012; 142: 1592-1509.
51. Gambineri A, Pelusi C, Vicennati V et al.: Obesity and the polycystic ovary syndrome. Int J Obes Relat Metab Disord 2002; 26: 883-896.